|
Download Data (XLS File) |
|
||||||||
|
||||||||
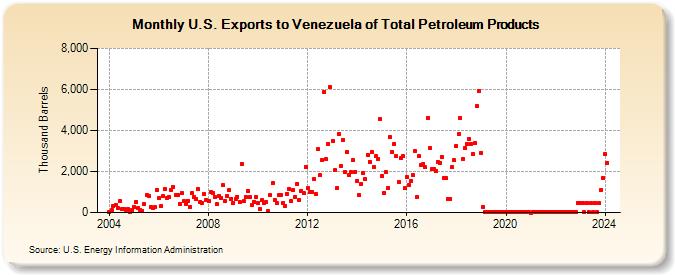
| U.S. Exports to Venezuela of Total Petroleum Products (Thousand Barrels) | ||||||||
| Year | Jan | Feb | Mar | Apr | May | Jun | Jul | Aug | Sep | Oct | Nov | Dec |
|---|---|---|---|---|---|---|---|---|---|---|---|---|
| 2004 | 8 | 110 | 339 | 374 | 244 | 550 | 180 | 195 | 141 | 160 | 10 | 124 |
| 2005 | 285 | 528 | 204 | 136 | 80 | 394 | 845 | 830 | 282 | 236 | 262 | 1,089 |
| 2006 | 690 | 319 | 784 | 1,143 | 715 | 760 | 1,116 | 1,254 | 864 | 854 | 439 | 962 |
| 2007 | 551 | 425 | 581 | 282 | 933 | 737 | 683 | 1,124 | 535 | 455 | 891 | 620 |
| 2008 | 584 | 995 | 942 | 774 | 404 | 815 | 733 | 1,323 | 569 | 825 | 1,105 | 676 |
| 2009 | 465 | 658 | 773 | 526 | 2,382 | 547 | 738 | 1,062 | 735 | 359 | 529 | 759 |
| 2010 | 465 | 163 | 595 | 484 | 515 | 55 | 846 | 1,431 | 615 | 469 | 832 | 875 |
| 2011 | 464 | 337 | 928 | 1,161 | 544 | 1,114 | 757 | 1,405 | 604 | 1,055 | 953 | 2,210 |
| 2012 | 1,182 | 998 | 1,023 | 1,628 | 890 | 3,084 | 1,816 | 2,571 | 5,882 | 2,588 | 3,338 | 6,111 |
| 2013 | 3,490 | 2,057 | 1,181 | 3,817 | 2,245 | 3,557 | 1,998 | 2,965 | 1,835 | 1,954 | 2,546 | 1,991 |
| 2014 | 1,562 | 843 | 1,410 | 1,935 | 1,616 | 2,814 | 2,476 | 2,939 | 2,230 | 2,743 | 2,597 | 4,539 |
| 2015 | 1,791 | 975 | 1,959 | 1,210 | 3,677 | 2,940 | 3,345 | 2,741 | 1,486 | 2,657 | 2,747 | 1,179 |
| 2016 | 1,723 | 1,356 | 1,542 | 1,828 | 2,999 | 741 | 2,744 | 2,334 | 2,382 | 2,196 | 4,627 | 3,128 |
| 2017 | 2,109 | 2,139 | 2,016 | 2,485 | 2,424 | 2,713 | 1,688 | 1,670 | 658 | 676 | 2,197 | 2,540 |
| 2018 | 3,241 | 3,811 | 4,622 | 2,587 | 3,148 | 3,356 | 3,608 | 3,364 | 2,868 | 3,405 | 5,175 | 5,936 |
| 2019 | 2,913 | 274 | 18 | 23 | 21 | 14 | 14 | 12 | 8 | 9 | 9 | 7 |
| 2020 | 7 | 9 | 16 | 6 | 5 | 14 | 6 | 9 | 5 | 5 | 4 | 4 |
| 2021 | 2 | 7 | 5 | 27 | 9 | 7 | 3 | 18 | 6 | 14 | 14 | 11 |
| 2022 | 8 | 11 | 6 | 10 | 11 | 8 | 5 | 8 | 10 | 17 | 10 | 458 |
| 2023 | 460 | 456 | 15 | 457 | 12 | 457 | 11 | 472 | 11 | 460 | 1,091 | 1,697 |
| 2024 | 2,850 | |||||||||||
| - = No Data Reported; -- = Not Applicable; NA = Not Available; W = Withheld to avoid disclosure of individual company data. |
| Release Date: 3/29/2024 |
| Next Release Date: 4/30/2024 |