|
Download Data (XLS File) |
|
||||||||
|
||||||||
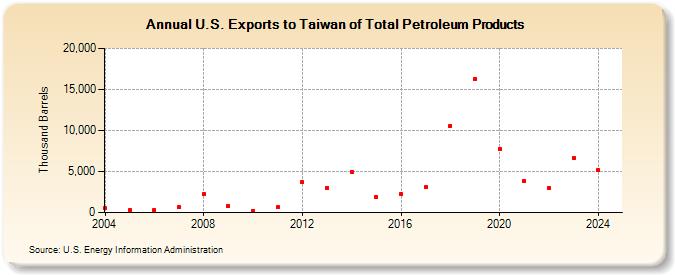
| U.S. Exports to Taiwan of Total Petroleum Products (Thousand Barrels) | ||||||||
| Decade | Year-0 | Year-1 | Year-2 | Year-3 | Year-4 | Year-5 | Year-6 | Year-7 | Year-8 | Year-9 |
|---|---|---|---|---|---|---|---|---|---|---|
| 2000's | 582 | 275 | 320 | 630 | 2,264 | 776 | ||||
| 2010's | 238 | 619 | 3,671 | 3,005 | 4,946 | 1,866 | 2,262 | 3,100 | 10,588 | 16,286 |
| 2020's | 7,757 | 3,850 | 2,964 | 6,664 |
| - = No Data Reported; -- = Not Applicable; NA = Not Available; W = Withheld to avoid disclosure of individual company data. |
| Release Date: 3/29/2024 |
| Next Release Date: 8/30/2024 |