|
Download Data (XLS File) |
|
||||||||
|
||||||||
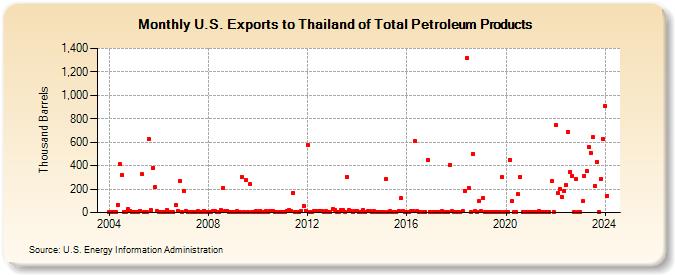
| U.S. Exports to Thailand of Total Petroleum Products (Thousand Barrels) | ||||||||
| Year | Jan | Feb | Mar | Apr | May | Jun | Jul | Aug | Sep | Oct | Nov | Dec |
|---|---|---|---|---|---|---|---|---|---|---|---|---|
| 2004 | 2 | 3 | 3 | 3 | 68 | 411 | 324 | 4 | 5 | 31 | 13 | 6 |
| 2005 | 3 | 4 | 5 | 17 | 326 | 5 | 3 | 628 | 22 | 384 | 214 | 12 |
| 2006 | 3 | 4 | 7 | 7 | 23 | 9 | 3 | 2 | 66 | 13 | 271 | 6 |
| 2007 | 180 | 15 | 5 | 6 | 6 | 5 | 4 | 12 | 7 | 8 | 16 | 4 |
| 2008 | 7 | 7 | 10 | 12 | 8 | 7 | 20 | 213 | 13 | 16 | 8 | 3 |
| 2009 | 5 | 3 | 11 | 5 | 306 | 6 | 277 | 6 | 241 | 6 | 5 | 14 |
| 2010 | 5 | 17 | 8 | 7 | 14 | 9 | 11 | 11 | 7 | 9 | 9 | 6 |
| 2011 | 9 | 7 | 15 | 23 | 17 | 169 | 9 | 7 | 5 | 16 | 60 | 16 |
| 2012 | 575 | 8 | 9 | 11 | 10 | 14 | 10 | 11 | 9 | 13 | 5 | 9 |
| 2013 | 29 | 24 | 7 | 9 | 18 | 21 | 6 | 306 | 18 | 12 | 9 | 16 |
| 2014 | 13 | 5 | 9 | 19 | 6 | 13 | 10 | 7 | 12 | 6 | 4 | 4 |
| 2015 | 5 | 4 | 287 | 7 | 11 | 5 | 6 | 6 | 13 | 121 | 12 | 4 |
| 2016 | 6 | 5 | 11 | 11 | 608 | 13 | 6 | 6 | 7 | 8 | 449 | 9 |
| 2017 | 5 | 4 | 7 | 8 | 7 | 12 | 7 | 9 | 3 | 408 | 10 | 4 |
| 2018 | 4 | 8 | 4 | 10 | 183 | 1,319 | 210 | 4 | 503 | 10 | 4 | 98 |
| 2019 | 10 | 125 | 3 | 3 | 7 | 4 | 4 | 5 | 2 | 6 | 300 | 4 |
| 2020 | 4 | 4 | 452 | 97 | 4 | 3 | 156 | 305 | 4 | 3 | 5 | 6 |
| 2021 | 5 | 7 | 7 | 5 | 13 | 6 | 8 | 7 | 2 | 5 | 265 | 9 |
| 2022 | 745 | 165 | 199 | 135 | 185 | 234 | 691 | 344 | 312 | 7 | 282 | 5 |
| 2023 | 5 | 96 | 314 | 351 | 558 | 511 | 641 | 229 | 435 | 9 | 289 | 628 |
| 2024 | 911 | |||||||||||
| - = No Data Reported; -- = Not Applicable; NA = Not Available; W = Withheld to avoid disclosure of individual company data. |
| Release Date: 3/29/2024 |
| Next Release Date: 4/30/2024 |