|
Download Data (XLS File) |
|
||||||||
|
||||||||
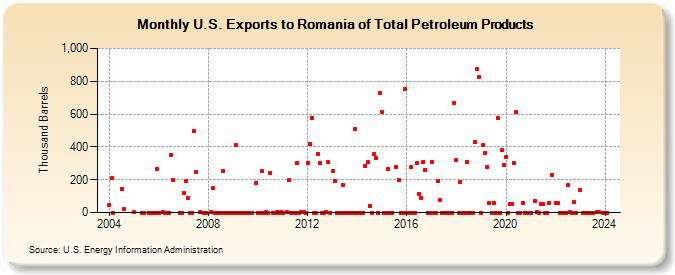
| U.S. Exports to Romania of Total Petroleum Products (Thousand Barrels) | ||||||||
| Year | Jan | Feb | Mar | Apr | May | Jun | Jul | Aug | Sep | Oct | Nov | Dec |
|---|---|---|---|---|---|---|---|---|---|---|---|---|
| 2004 | 49 | 212 | 0 | 146 | 22 | |||||||
| 2005 | 1 | 0 | 0 | 0 | 0 | 0 | 0 | 263 | ||||
| 2006 | 0 | 1 | 0 | 0 | 0 | 351 | 199 | 0 | 0 | |||
| 2007 | 119 | 191 | 91 | 0 | 0 | 497 | 246 | 1 | 0 | 0 | ||
| 2008 | 2 | 152 | 0 | 0 | 0 | 0 | 255 | 0 | 0 | 0 | 0 | |
| 2009 | 0 | 412 | 0 | 0 | 0 | 0 | 0 | 0 | 0 | 0 | 182 | |
| 2010 | 0 | 0 | 251 | 0 | 3 | 0 | 241 | 0 | 0 | 2 | 0 | 1 |
| 2011 | 0 | 1 | 196 | 0 | 0 | 0 | 301 | 0 | 1 | 1 | 0 | |
| 2012 | 301 | 420 | 575 | 0 | 0 | 356 | 301 | 0 | 0 | 2 | 305 | 0 |
| 2013 | 255 | 193 | 0 | 0 | 0 | 165 | 0 | 0 | 0 | 0 | 0 | 512 |
| 2014 | 0 | 0 | 0 | 0 | 285 | 306 | 43 | 0 | 356 | 330 | 0 | 729 |
| 2015 | 615 | 0 | 0 | 263 | 0 | 0 | 275 | 198 | 0 | 0 | 752 | |
| 2016 | 0 | 0 | 275 | 0 | 0 | 302 | 116 | 91 | 309 | 260 | 0 | 0 |
| 2017 | 311 | 0 | 0 | 192 | 77 | 0 | 0 | 0 | 0 | 0 | 0 | 669 |
| 2018 | 320 | 0 | 187 | 0 | 0 | 307 | 0 | 0 | 0 | 430 | 872 | 824 |
| 2019 | 0 | 409 | 363 | 278 | 61 | 0 | 61 | 0 | 579 | 0 | 380 | 289 |
| 2020 | 341 | 0 | 55 | 55 | 303 | 614 | 0 | 0 | 61 | 0 | 0 | 0 |
| 2021 | 0 | 72 | 1 | 0 | 51 | 50 | 0 | 0 | 61 | 228 | ||
| 2022 | 61 | 56 | 0 | 0 | 0 | 0 | 166 | 1 | 0 | 62 | 0 | |
| 2023 | 139 | 0 | 0 | 0 | 0 | 0 | 0 | 1 | 1 | 0 | ||
| 2024 | 0 | |||||||||||
| - = No Data Reported; -- = Not Applicable; NA = Not Available; W = Withheld to avoid disclosure of individual company data. |
| Release Date: 3/29/2024 |
| Next Release Date: 4/30/2024 |