|
Download Data (XLS File) |
|
||||||||
|
||||||||
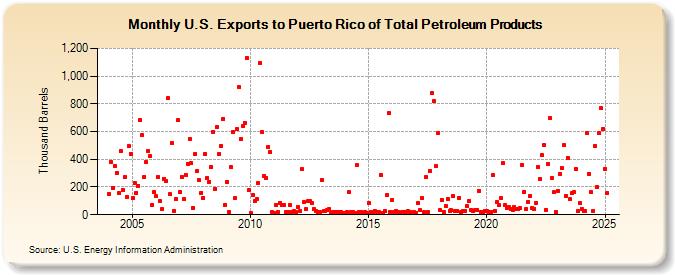
| U.S. Exports to Puerto Rico of Total Petroleum Products (Thousand Barrels) | ||||||||
| Year | Jan | Feb | Mar | Apr | May | Jun | Jul | Aug | Sep | Oct | Nov | Dec |
|---|---|---|---|---|---|---|---|---|---|---|---|---|
| 2004 | 149 | 382 | 194 | 355 | 304 | 155 | 461 | 181 | 273 | 128 | 496 | 441 |
| 2005 | 119 | 229 | 157 | 209 | 685 | 578 | 275 | 381 | 457 | 421 | 71 | 162 |
| 2006 | 133 | 273 | 97 | 40 | 260 | 241 | 839 | 146 | 516 | 30 | 115 | 681 |
| 2007 | 164 | 275 | 110 | 289 | 369 | 549 | 371 | 52 | 439 | 317 | 248 | 157 |
| 2008 | 123 | 438 | 264 | 239 | 346 | 600 | 188 | 633 | 440 | 495 | 694 | 73 |
| 2009 | 239 | 20 | 342 | 595 | 118 | 617 | 922 | 545 | 639 | 665 | 1,132 | 175 |
| 2010 | 13 | 142 | 101 | 112 | 228 | 1,095 | 596 | 278 | 266 | 489 | 453 | 21 |
| 2011 | 13 | 69 | 21 | 85 | 67 | 69 | 17 | 23 | 69 | 22 | 25 | 23 |
| 2012 | 58 | 25 | 331 | 89 | 38 | 97 | 96 | 87 | 40 | 24 | 19 | 20 |
| 2013 | 251 | 24 | 25 | 32 | 41 | 15 | 18 | 22 | 16 | 19 | 18 | 13 |
| 2014 | 15 | 20 | 161 | 21 | 21 | 15 | 356 | 22 | 22 | 15 | 18 | 13 |
| 2015 | 85 | 20 | 23 | 24 | 19 | 20 | 290 | 15 | 25 | 141 | 732 | 20 |
| 2016 | 107 | 20 | 25 | 23 | 15 | 17 | 19 | 18 | 24 | 21 | 14 | 16 |
| 2017 | 14 | 84 | 31 | 121 | 17 | 270 | 19 | 316 | 875 | 819 | 349 | 586 |
| 2018 | 31 | 109 | 22 | 64 | 111 | 24 | 31 | 132 | 24 | 26 | 123 | 20 |
| 2019 | 28 | 27 | 61 | 99 | 33 | 25 | 32 | 36 | 174 | 18 | 23 | 26 |
| 2020 | 26 | 16 | 23 | 284 | 30 | 90 | 68 | 117 | 371 | 68 | 50 | 59 |
| 2021 | 42 | 35 | 53 | 44 | 40 | 47 | 359 | 167 | 41 | 92 | 136 | 47 |
| 2022 | 42 | 88 | 346 | 260 | 428 | 504 | 36 | 366 | 696 | 268 | 161 | 21 |
| 2023 | 172 | 296 | 339 | 501 | 138 | 412 | 111 | 154 | 161 | 331 | 24 | 86 |
| 2024 | 42 | 24 | 26 | 591 | 296 | 161 | ||||||
| - = No Data Reported; -- = Not Applicable; NA = Not Available; W = Withheld to avoid disclosure of individual company data. |
| Release Date: 8/30/2024 |
| Next Release Date: 9/30/2024 |