|
Download Data (XLS File) |
|
||||||||
|
||||||||
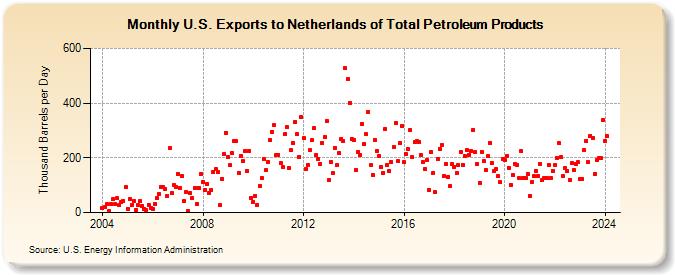
| U.S. Exports to Netherlands of Total Petroleum Products (Thousand Barrels per Day) | ||||||||
| Year | Jan | Feb | Mar | Apr | May | Jun | Jul | Aug | Sep | Oct | Nov | Dec |
|---|---|---|---|---|---|---|---|---|---|---|---|---|
| 2004 | 16 | 19 | 30 | 6 | 32 | 48 | 30 | 52 | 27 | 39 | 43 | 93 |
| 2005 | 14 | 48 | 28 | 42 | 10 | 26 | 42 | 25 | 14 | 10 | 29 | 16 |
| 2006 | 13 | 33 | 52 | 68 | 95 | 94 | 86 | 62 | 235 | 70 | 100 | 92 |
| 2007 | 142 | 91 | 134 | 41 | 76 | 6 | 72 | 52 | 90 | 32 | 91 | 141 |
| 2008 | 111 | 84 | 106 | 72 | 82 | 147 | 158 | 149 | 26 | 124 | 214 | 292 |
| 2009 | 203 | 172 | 217 | 261 | 260 | 145 | 207 | 187 | 224 | 152 | 226 | 55 |
| 2010 | 39 | 61 | 29 | 97 | 127 | 195 | 154 | 185 | 265 | 295 | 319 | 209 |
| 2011 | 212 | 180 | 167 | 287 | 312 | 163 | 227 | 256 | 331 | 286 | 204 | 348 |
| 2012 | 273 | 161 | 175 | 227 | 264 | 308 | 210 | 197 | 179 | 254 | 277 | 334 |
| 2013 | 118 | 185 | 143 | 237 | 172 | 218 | 269 | 261 | 527 | 488 | 402 | 269 |
| 2014 | 265 | 156 | 223 | 211 | 325 | 250 | 286 | 369 | 172 | 139 | 265 | 225 |
| 2015 | 208 | 166 | 145 | 306 | 174 | 151 | 184 | 239 | 328 | 187 | 254 | 317 |
| 2016 | 183 | 213 | 233 | 302 | 202 | 258 | 262 | 259 | 212 | 184 | 161 | 192 |
| 2017 | 83 | 221 | 145 | 74 | 194 | 233 | 247 | 133 | 178 | 131 | 97 | 178 |
| 2018 | 168 | 145 | 173 | 223 | 175 | 208 | 229 | 212 | 225 | 302 | 221 | 178 |
| 2019 | 109 | 223 | 187 | 157 | 206 | 256 | 182 | 151 | 158 | 132 | 110 | 197 |
| 2020 | 191 | 208 | 163 | 101 | 139 | 179 | 175 | 127 | 224 | 127 | 127 | 141 |
| 2021 | 62 | 112 | 132 | 153 | 133 | 179 | 120 | 127 | 127 | 174 | 127 | 153 |
| 2022 | 172 | 201 | 253 | 202 | 133 | 162 | 152 | 120 | 181 | 156 | 179 | 183 |
| 2023 | 121 | 123 | 227 | 261 | 183 | 281 | 273 | 142 | 191 | 198 | 199 | 339 |
| 2024 | 262 | |||||||||||
| - = No Data Reported; -- = Not Applicable; NA = Not Available; W = Withheld to avoid disclosure of individual company data. |
| Release Date: 3/29/2024 |
| Next Release Date: 4/30/2024 |