|
Download Data (XLS File) |
|
||||||||
|
||||||||
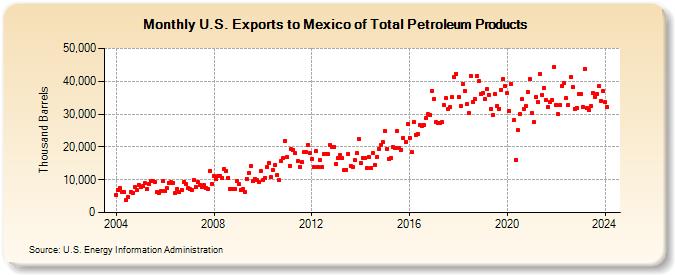
| U.S. Exports to Mexico of Total Petroleum Products (Thousand Barrels) | ||||||||
| Year | Jan | Feb | Mar | Apr | May | Jun | Jul | Aug | Sep | Oct | Nov | Dec |
|---|---|---|---|---|---|---|---|---|---|---|---|---|
| 2004 | 5,375 | 6,789 | 7,372 | 6,218 | 6,321 | 3,916 | 4,668 | 6,303 | 6,063 | 7,893 | 6,990 | 8,505 |
| 2005 | 7,890 | 8,014 | 8,851 | 7,271 | 8,605 | 9,574 | 9,753 | 9,321 | 6,224 | 6,059 | 6,707 | 9,598 |
| 2006 | 6,649 | 7,475 | 9,088 | 9,219 | 9,072 | 5,995 | 7,247 | 6,139 | 6,894 | 9,194 | 8,647 | 7,370 |
| 2007 | 7,223 | 6,779 | 9,965 | 7,794 | 9,301 | 8,415 | 7,671 | 8,370 | 7,607 | 7,326 | 12,626 | 8,666 |
| 2008 | 11,059 | 10,144 | 11,042 | 11,227 | 10,487 | 13,276 | 12,655 | 10,623 | 7,215 | 7,237 | 7,298 | 9,571 |
| 2009 | 8,750 | 6,892 | 7,241 | 6,394 | 10,239 | 11,941 | 14,099 | 9,566 | 10,343 | 9,941 | 9,449 | 12,599 |
| 2010 | 9,919 | 10,665 | 13,914 | 15,136 | 10,798 | 13,023 | 14,479 | 11,561 | 9,803 | 15,656 | 16,548 | 21,939 |
| 2011 | 16,873 | 14,326 | 19,274 | 19,143 | 18,061 | 15,636 | 13,914 | 15,256 | 18,315 | 18,360 | 20,591 | 18,122 |
| 2012 | 16,458 | 13,929 | 18,743 | 13,911 | 15,939 | 13,786 | 17,787 | 17,784 | 17,706 | 20,591 | 20,101 | 20,022 |
| 2013 | 14,789 | 16,496 | 17,503 | 16,615 | 12,872 | 13,054 | 17,939 | 14,219 | 13,994 | 16,001 | 18,063 | 22,481 |
| 2014 | 15,245 | 16,674 | 16,699 | 13,504 | 17,009 | 13,652 | 18,050 | 14,533 | 17,009 | 19,395 | 20,703 | 21,383 |
| 2015 | 24,742 | 19,419 | 16,344 | 16,723 | 19,883 | 19,757 | 24,968 | 19,655 | 19,186 | 22,736 | 21,537 | 26,894 |
| 2016 | 22,845 | 18,364 | 27,615 | 23,738 | 23,955 | 26,619 | 26,302 | 26,753 | 28,779 | 29,974 | 29,825 | 37,156 |
| 2017 | 34,710 | 27,442 | 27,374 | 27,265 | 27,509 | 32,608 | 34,866 | 31,669 | 32,206 | 35,119 | 41,305 | 42,329 |
| 2018 | 35,233 | 32,322 | 39,079 | 37,130 | 33,083 | 30,232 | 41,621 | 33,723 | 34,584 | 41,736 | 39,926 | 36,240 |
| 2019 | 36,491 | 34,563 | 37,503 | 35,909 | 31,555 | 29,803 | 36,116 | 32,322 | 31,680 | 37,454 | 40,656 | 38,512 |
| 2020 | 36,300 | 30,947 | 39,134 | 28,047 | 16,145 | 25,051 | 29,941 | 34,542 | 31,577 | 32,406 | 36,703 | 40,535 |
| 2021 | 30,359 | 27,546 | 35,187 | 33,639 | 42,259 | 35,918 | 37,996 | 34,309 | 32,154 | 33,647 | 34,335 | 44,462 |
| 2022 | 32,909 | 29,878 | 32,671 | 38,655 | 39,366 | 34,819 | 32,832 | 41,277 | 38,287 | 31,571 | 31,801 | 36,253 |
| 2023 | 36,091 | 32,296 | 43,791 | 31,755 | 31,214 | 32,488 | 36,520 | 35,220 | 36,226 | 38,621 | 34,119 | 36,967 |
| 2024 | 33,666 | |||||||||||
| - = No Data Reported; -- = Not Applicable; NA = Not Available; W = Withheld to avoid disclosure of individual company data. |
| Release Date: 3/29/2024 |
| Next Release Date: 4/30/2024 |