|
Download Data (XLS File) |
|
||||||||
|
||||||||
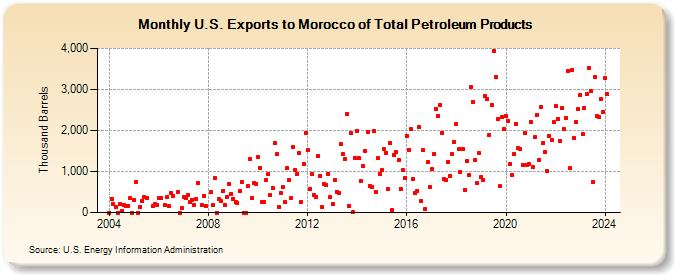
| U.S. Exports to Morocco of Total Petroleum Products (Thousand Barrels) | ||||||||
| Year | Jan | Feb | Mar | Apr | May | Jun | Jul | Aug | Sep | Oct | Nov | Dec |
|---|---|---|---|---|---|---|---|---|---|---|---|---|
| 2004 | 0 | 341 | 220 | 144 | 1 | 212 | 41 | 196 | 151 | 168 | 360 | 0 |
| 2005 | 309 | 749 | 0 | 142 | 276 | 378 | 353 | 151 | 197 | 174 | ||
| 2006 | 351 | 358 | 178 | 373 | 149 | 480 | 412 | 492 | 0 | 110 | ||
| 2007 | 376 | 345 | 421 | 260 | 308 | 191 | 334 | 724 | 178 | 414 | 156 | |
| 2008 | 496 | 178 | 843 | 0 | 328 | 271 | 535 | 184 | 391 | 705 | 462 | |
| 2009 | 341 | 252 | 224 | 516 | 744 | 0 | 0 | 651 | 1,303 | 357 | 716 | 696 |
| 2010 | 1,354 | 1,087 | 248 | 264 | 785 | 936 | 422 | 598 | 1,698 | 1,430 | 138 | 477 |
| 2011 | 621 | 248 | 1,081 | 785 | 346 | 1,593 | 1,043 | 951 | 1,453 | 266 | 1,187 | 1,940 |
| 2012 | 1,535 | 562 | 934 | 430 | 387 | 1,376 | 894 | 130 | 697 | 670 | 949 | 370 |
| 2013 | 204 | 796 | 512 | 478 | 1,671 | 1,422 | 1,294 | 2,405 | 161 | 1,939 | 16 | 1,319 |
| 2014 | 1,999 | 1,319 | 758 | 1,123 | 1,494 | 1,966 | 657 | 616 | 1,981 | 502 | 1,318 | 942 |
| 2015 | 1,039 | 1,545 | 1,458 | 565 | 1,696 | 61 | 1,396 | 1,476 | 1,287 | 582 | 1,040 | 851 |
| 2016 | 1,860 | 1,525 | 2,035 | 821 | 476 | 514 | 2,083 | 279 | 1,521 | 91 | 1,231 | 625 |
| 2017 | 1,052 | 1,422 | 2,516 | 2,364 | 2,625 | 1,946 | 808 | 800 | 1,243 | 900 | 1,418 | 1,722 |
| 2018 | 2,156 | 1,538 | 997 | 1,557 | 561 | 1,250 | 910 | 3,061 | 2,697 | 1,281 | 716 | 1,442 |
| 2019 | 862 | 792 | 2,842 | 2,766 | 1,895 | 2,625 | 3,939 | 3,314 | 2,272 | 636 | 2,320 | 2,030 |
| 2020 | 2,362 | 2,231 | 1,181 | 927 | 1,418 | 2,162 | 1,562 | 1,554 | 1,170 | 1,936 | 1,159 | 1,171 |
| 2021 | 2,203 | 1,101 | 1,832 | 2,385 | 1,276 | 2,583 | 1,690 | 1,464 | 1,009 | 1,860 | 1,773 | 2,205 |
| 2022 | 2,594 | 2,286 | 1,752 | 2,543 | 2,024 | 2,296 | 3,438 | 1,076 | 3,484 | 1,821 | 2,218 | 2,520 |
| 2023 | 2,871 | 1,906 | 2,546 | 2,881 | 3,517 | 2,950 | 746 | 3,311 | 2,357 | 2,328 | 2,770 | 2,461 |
| 2024 | 3,285 | |||||||||||
| - = No Data Reported; -- = Not Applicable; NA = Not Available; W = Withheld to avoid disclosure of individual company data. |
| Release Date: 3/29/2024 |
| Next Release Date: 4/30/2024 |