|
Download Data (XLS File) |
|
||||||||
|
||||||||
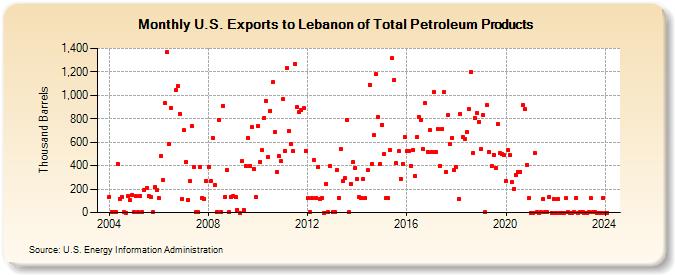
| U.S. Exports to Lebanon of Total Petroleum Products (Thousand Barrels) | ||||||||
| Year | Jan | Feb | Mar | Apr | May | Jun | Jul | Aug | Sep | Oct | Nov | Dec |
|---|---|---|---|---|---|---|---|---|---|---|---|---|
| 2004 | 135 | 1 | 3 | 1 | 415 | 118 | 136 | 2 | 0 | 139 | 106 | 150 |
| 2005 | 4 | 139 | 1 | 142 | 1 | 193 | 209 | 141 | 136 | 1 | 215 | 193 |
| 2006 | 120 | 482 | 275 | 931 | 1,367 | 586 | 893 | 1,042 | 1,079 | 843 | 118 | |
| 2007 | 702 | 433 | 110 | 265 | 736 | 388 | 1 | 1 | 386 | 127 | 119 | 268 |
| 2008 | 389 | 268 | 640 | 236 | 2 | 790 | 7 | 909 | 136 | 365 | 1 | 136 |
| 2009 | 138 | 132 | 24 | 0 | 439 | 24 | 393 | 640 | 398 | 727 | 374 | 132 |
| 2010 | 742 | 432 | 530 | 810 | 953 | 474 | 869 | 1,110 | 691 | 347 | 482 | 437 |
| 2011 | 966 | 523 | 1,234 | 694 | 588 | 524 | 1,271 | 896 | 855 | 873 | 891 | 526 |
| 2012 | 122 | 2 | 124 | 449 | 126 | 387 | 119 | 124 | 0 | 247 | 1 | 399 |
| 2013 | 1 | 1 | 361 | 125 | 540 | 266 | 294 | 792 | 1 | 246 | 430 | 379 |
| 2014 | 286 | 134 | 125 | 288 | 124 | 362 | 1,091 | 415 | 659 | 1,181 | 817 | 412 |
| 2015 | 749 | 501 | 122 | 122 | 533 | 1,317 | 1,134 | 419 | 521 | 290 | 416 | 642 |
| 2016 | 522 | 522 | 400 | 537 | 313 | 645 | 815 | 790 | 539 | 931 | 519 | 701 |
| 2017 | 520 | 1,032 | 517 | 713 | 401 | 714 | 1,024 | 346 | 829 | 588 | 636 | 363 |
| 2018 | 388 | 118 | 837 | 644 | 630 | 686 | 879 | 1,197 | 507 | 806 | 850 | 773 |
| 2019 | 544 | 830 | 1 | 916 | 518 | 394 | 494 | 378 | 755 | 506 | 499 | 487 |
| 2020 | 266 | 530 | 489 | 261 | 205 | 320 | 349 | 350 | 915 | 880 | 409 | 124 |
| 2021 | 0 | 0 | 508 | 1 | 0 | 1 | 115 | 1 | 1 | 134 | 0 | 117 |
| 2022 | 0 | 116 | 0 | 0 | 0 | 121 | 1 | 0 | 0 | 1 | 127 | 0 |
| 2023 | 1 | 1 | 0 | 0 | 1 | 123 | 2 | 1 | 0 | 0 | 0 | 123 |
| 2024 | 0 | 0 | 2 | 1 | 0 | |||||||
| - = No Data Reported; -- = Not Applicable; NA = Not Available; W = Withheld to avoid disclosure of individual company data. |
| Release Date: 8/30/2024 |
| Next Release Date: 9/30/2024 |