|
Download Data (XLS File) |
|
||||||||
|
||||||||
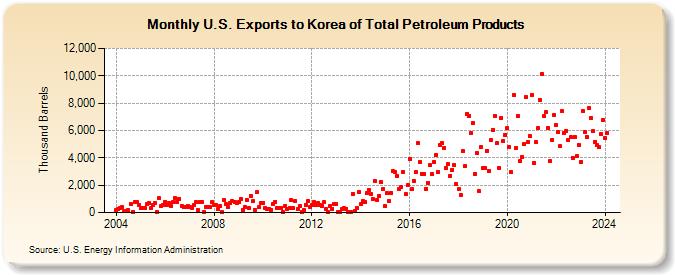
| U.S. Exports to Korea of Total Petroleum Products (Thousand Barrels) | ||||||||
| Year | Jan | Feb | Mar | Apr | May | Jun | Jul | Aug | Sep | Oct | Nov | Dec |
|---|---|---|---|---|---|---|---|---|---|---|---|---|
| 2004 | 215 | 230 | 342 | 377 | 143 | 91 | 179 | 615 | 41 | 790 | 776 | 563 |
| 2005 | 308 | 352 | 326 | 594 | 671 | 316 | 588 | 706 | 75 | 1,036 | 444 | 589 |
| 2006 | 805 | 534 | 679 | 465 | 736 | 1,067 | 736 | 1,012 | 482 | 373 | 391 | 477 |
| 2007 | 385 | 352 | 556 | 737 | 205 | 787 | 775 | 26 | 418 | 408 | 378 | 745 |
| 2008 | 538 | 555 | 240 | 467 | 12 | 912 | 598 | 394 | 666 | 853 | 801 | 709 |
| 2009 | 766 | 976 | 223 | 380 | 951 | 318 | 1,229 | 822 | 211 | 1,498 | 398 | 696 |
| 2010 | 705 | 363 | 228 | 243 | 215 | 621 | 808 | 367 | 333 | 327 | 22 | 489 |
| 2011 | 286 | 323 | 907 | 325 | 863 | 258 | 456 | 26 | 213 | 555 | 813 | 372 |
| 2012 | 531 | 750 | 536 | 722 | 538 | 488 | 752 | 272 | 15 | 498 | 290 | 598 |
| 2013 | 615 | 41 | 8 | 289 | 308 | 283 | 12 | 13 | 1,382 | 96 | 343 | 1,494 |
| 2014 | 616 | 822 | 793 | 1,410 | 1,671 | 1,327 | 1,018 | 2,274 | 927 | 1,215 | 2,238 | 1,710 |
| 2015 | 447 | 1,395 | 855 | 1,423 | 3,012 | 2,957 | 2,656 | 1,740 | 1,885 | 2,954 | 1,321 | 2,004 |
| 2016 | 3,911 | 1,716 | 2,317 | 2,953 | 5,055 | 3,661 | 2,854 | 2,835 | 1,729 | 2,193 | 3,453 | 2,813 |
| 2017 | 3,720 | 4,213 | 2,971 | 4,949 | 5,083 | 4,738 | 3,239 | 3,545 | 2,694 | 3,121 | 3,475 | 2,060 |
| 2018 | 1,723 | 1,313 | 4,506 | 3,380 | 7,184 | 7,027 | 5,804 | 6,536 | 2,818 | 4,344 | 1,557 | 4,790 |
| 2019 | 3,224 | 3,221 | 4,527 | 3,062 | 5,281 | 6,058 | 7,076 | 5,055 | 3,283 | 6,908 | 5,223 | 5,691 |
| 2020 | 6,154 | 4,806 | 2,939 | 8,610 | 4,692 | 7,065 | 3,736 | 4,039 | 5,009 | 8,442 | 5,183 | 5,630 |
| 2021 | 8,598 | 3,642 | 5,168 | 6,145 | 8,237 | 10,116 | 7,039 | 7,320 | 6,186 | 3,755 | 5,336 | 7,145 |
| 2022 | 6,410 | 5,901 | 4,861 | 7,398 | 5,833 | 5,989 | 5,323 | 5,489 | 4,012 | 5,515 | 4,136 | 4,961 |
| 2023 | 3,716 | 7,413 | 5,874 | 5,545 | 7,618 | 6,924 | 5,940 | 5,186 | 4,919 | 4,770 | 5,746 | 6,790 |
| 2024 | 5,457 | |||||||||||
| - = No Data Reported; -- = Not Applicable; NA = Not Available; W = Withheld to avoid disclosure of individual company data. |
| Release Date: 3/29/2024 |
| Next Release Date: 4/30/2024 |