|
Download Data (XLS File) |
|
||||||||
|
||||||||
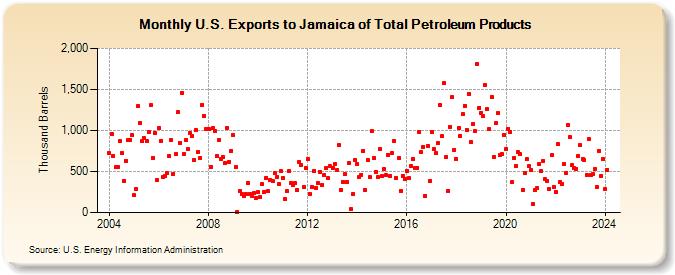
| U.S. Exports to Jamaica of Total Petroleum Products (Thousand Barrels) | ||||||||
| Year | Jan | Feb | Mar | Apr | May | Jun | Jul | Aug | Sep | Oct | Nov | Dec |
|---|---|---|---|---|---|---|---|---|---|---|---|---|
| 2004 | 721 | 963 | 687 | 549 | 550 | 866 | 725 | 388 | 632 | 882 | 878 | 943 |
| 2005 | 209 | 287 | 1,296 | 1,097 | 868 | 904 | 867 | 979 | 1,306 | 670 | 975 | 394 |
| 2006 | 1,032 | 877 | 436 | 448 | 481 | 690 | 884 | 475 | 712 | 1,220 | 853 | 1,462 |
| 2007 | 719 | 884 | 769 | 968 | 928 | 642 | 1,001 | 741 | 666 | 1,316 | 1,175 | 1,020 |
| 2008 | 1,019 | 557 | 1,028 | 997 | 688 | 890 | 656 | 677 | 605 | 1,033 | 622 | 755 |
| 2009 | 940 | 553 | 7 | 257 | 223 | 204 | 225 | 360 | 231 | 203 | 236 | 182 |
| 2010 | 253 | 188 | 346 | 253 | 426 | 258 | 396 | 381 | 477 | 434 | 342 | 505 |
| 2011 | 424 | 162 | 259 | 501 | 366 | 340 | 359 | 280 | 614 | 585 | 316 | 542 |
| 2012 | 655 | 224 | 317 | 505 | 303 | 359 | 494 | 340 | 460 | 548 | 420 | 563 |
| 2013 | 537 | 589 | 513 | 819 | 277 | 378 | 466 | 378 | 605 | 38 | 227 | 640 |
| 2014 | 595 | 435 | 461 | 754 | 275 | 639 | 429 | 989 | 668 | 499 | 433 | 776 |
| 2015 | 448 | 525 | 453 | 705 | 447 | 724 | 873 | 422 | 666 | 267 | 448 | 404 |
| 2016 | 506 | 415 | 567 | 655 | 540 | 548 | 985 | 737 | 801 | 204 | 811 | 383 |
| 2017 | 981 | 774 | 721 | 843 | 1,310 | 928 | 1,578 | 675 | 264 | 1,047 | 1,404 | 767 |
| 2018 | 650 | 1,036 | 936 | 1,196 | 1,304 | 1,010 | 1,441 | 857 | 1,078 | 990 | 1,814 | 1,279 |
| 2019 | 1,218 | 1,171 | 1,553 | 1,257 | 1,019 | 1,410 | 678 | 1,089 | 1,212 | 701 | 708 | 946 |
| 2020 | 775 | 1,021 | 983 | 369 | 662 | 570 | 734 | 708 | 274 | 477 | 649 | 562 |
| 2021 | 517 | 110 | 273 | 294 | 590 | 508 | 630 | 403 | 389 | 290 | 696 | 311 |
| 2022 | 255 | 833 | 368 | 351 | 586 | 477 | 1,071 | 920 | 576 | 541 | 535 | 689 |
| 2023 | 823 | 656 | 638 | 459 | 899 | 452 | 471 | 525 | 315 | 755 | 444 | 648 |
| 2024 | 283 | |||||||||||
| - = No Data Reported; -- = Not Applicable; NA = Not Available; W = Withheld to avoid disclosure of individual company data. |
| Release Date: 3/29/2024 |
| Next Release Date: 4/30/2024 |