|
Download Data (XLS File) |
|
||||||||
|
||||||||
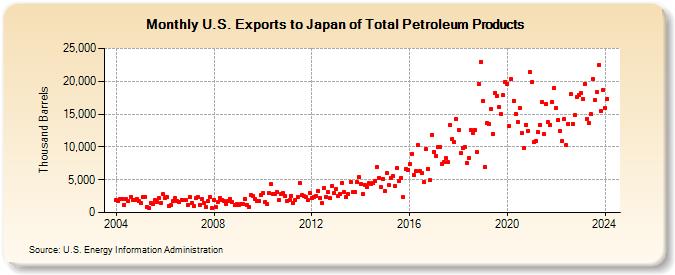
| U.S. Exports to Japan of Total Petroleum Products (Thousand Barrels) | ||||||||
| Year | Jan | Feb | Mar | Apr | May | Jun | Jul | Aug | Sep | Oct | Nov | Dec |
|---|---|---|---|---|---|---|---|---|---|---|---|---|
| 2004 | 1,925 | 1,777 | 2,058 | 2,119 | 1,207 | 1,990 | 1,814 | 2,392 | 1,871 | 1,907 | 2,133 | 1,688 |
| 2005 | 1,453 | 2,295 | 2,432 | 917 | 674 | 1,462 | 1,289 | 1,927 | 1,597 | 2,204 | 1,526 | 2,768 |
| 2006 | 2,269 | 2,352 | 952 | 1,140 | 1,767 | 2,162 | 1,769 | 1,629 | 1,937 | 1,978 | 1,933 | 1,164 |
| 2007 | 2,295 | 1,498 | 963 | 2,167 | 2,325 | 1,217 | 2,047 | 1,469 | 922 | 1,747 | 2,435 | 646 |
| 2008 | 1,945 | 839 | 1,643 | 2,255 | 1,919 | 1,787 | 1,343 | 1,820 | 2,056 | 1,602 | 1,177 | 1,262 |
| 2009 | 1,142 | 1,318 | 1,234 | 2,064 | 1,197 | 880 | 2,694 | 2,474 | 2,035 | 1,757 | 1,731 | 2,711 |
| 2010 | 3,009 | 1,629 | 1,286 | 2,934 | 4,341 | 2,890 | 2,891 | 3,115 | 1,950 | 2,821 | 2,932 | 2,466 |
| 2011 | 1,693 | 1,893 | 2,592 | 1,477 | 1,949 | 2,364 | 4,501 | 2,672 | 2,514 | 2,351 | 1,850 | 2,990 |
| 2012 | 2,180 | 2,390 | 2,567 | 3,295 | 2,216 | 1,440 | 3,725 | 2,439 | 3,073 | 2,213 | 4,092 | 2,952 |
| 2013 | 3,593 | 2,571 | 2,874 | 4,557 | 3,160 | 2,341 | 2,841 | 4,669 | 3,066 | 3,102 | 4,659 | 5,409 |
| 2014 | 4,412 | 2,820 | 4,262 | 3,837 | 4,457 | 4,359 | 4,520 | 4,810 | 6,904 | 5,317 | 3,858 | 5,125 |
| 2015 | 3,228 | 5,983 | 4,157 | 5,338 | 5,497 | 4,000 | 6,810 | 4,847 | 5,299 | 2,326 | 6,666 | 6,472 |
| 2016 | 7,354 | 8,912 | 5,717 | 6,311 | 10,216 | 6,253 | 6,081 | 4,668 | 9,671 | 6,706 | 4,947 | 11,862 |
| 2017 | 9,279 | 8,562 | 10,021 | 9,999 | 7,420 | 7,668 | 8,263 | 7,651 | 13,352 | 11,175 | 10,692 | 14,221 |
| 2018 | 12,604 | 9,045 | 9,860 | 9,999 | 7,606 | 8,261 | 12,576 | 12,178 | 12,624 | 9,240 | 19,604 | 23,000 |
| 2019 | 17,040 | 6,954 | 13,599 | 13,479 | 15,773 | 11,990 | 18,265 | 17,800 | 16,086 | 14,986 | 17,861 | 19,944 |
| 2020 | 19,631 | 13,162 | 20,301 | 17,038 | 15,051 | 13,799 | 15,909 | 12,097 | 9,782 | 13,403 | 12,472 | 21,407 |
| 2021 | 19,869 | 10,692 | 10,874 | 12,231 | 13,372 | 16,818 | 11,901 | 16,463 | 13,784 | 13,360 | 16,859 | 19,015 |
| 2022 | 15,945 | 14,139 | 12,398 | 10,875 | 14,245 | 10,245 | 13,532 | 18,018 | 13,449 | 14,816 | 17,576 | 17,916 |
| 2023 | 18,217 | 17,326 | 19,614 | 14,265 | 13,682 | 14,999 | 20,411 | 17,122 | 18,288 | 22,497 | 15,461 | 18,726 |
| 2024 | 15,967 | |||||||||||
| - = No Data Reported; -- = Not Applicable; NA = Not Available; W = Withheld to avoid disclosure of individual company data. |
| Release Date: 3/29/2024 |
| Next Release Date: 4/30/2024 |