|
Download Data (XLS File) |
|
||||||||
|
||||||||
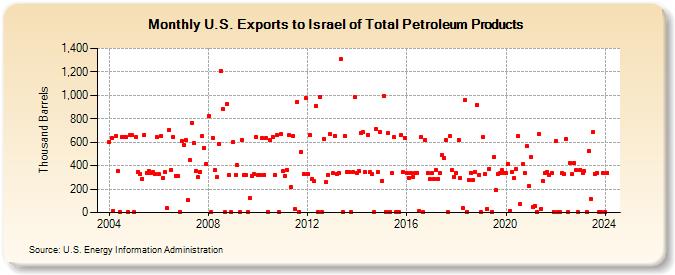
| U.S. Exports to Israel of Total Petroleum Products (Thousand Barrels) | ||||||||
| Year | Jan | Feb | Mar | Apr | May | Jun | Jul | Aug | Sep | Oct | Nov | Dec |
|---|---|---|---|---|---|---|---|---|---|---|---|---|
| 2004 | 605 | 635 | 12 | 651 | 351 | 3 | 643 | 647 | 644 | 4 | 659 | 658 |
| 2005 | 2 | 646 | 349 | 327 | 290 | 663 | 338 | 355 | 340 | 342 | 332 | 642 |
| 2006 | 326 | 653 | 293 | 343 | 36 | 707 | 366 | 643 | 314 | 309 | 8 | 611 |
| 2007 | 573 | 615 | 105 | 448 | 766 | 591 | 355 | 301 | 350 | 652 | 552 | 417 |
| 2008 | 825 | 2 | 639 | 362 | 304 | 586 | 1,207 | 880 | 2 | 924 | 320 | 2 |
| 2009 | 603 | 323 | 404 | 2 | 620 | 324 | 323 | 3 | 124 | 315 | 325 | 643 |
| 2010 | 324 | 324 | 636 | 324 | 637 | 5 | 617 | 647 | 324 | 659 | 6 | 671 |
| 2011 | 351 | 316 | 365 | 660 | 214 | 657 | 28 | 947 | 7 | 518 | 327 | 973 |
| 2012 | 331 | 660 | 289 | 265 | 912 | 3 | 987 | 7 | 629 | 260 | 324 | 667 |
| 2013 | 335 | 656 | 329 | 338 | 1,309 | 3 | 655 | 345 | 342 | 5 | 345 | 982 |
| 2014 | 339 | 351 | 678 | 683 | 343 | 664 | 342 | 326 | 4 | 711 | 343 | 685 |
| 2015 | 270 | 992 | 5 | 676 | 8 | 336 | 644 | 9 | 4 | 659 | 342 | 638 |
| 2016 | 340 | 297 | 339 | 303 | 337 | 338 | 14 | 642 | 3 | 615 | 338 | 282 |
| 2017 | 336 | 287 | 363 | 287 | 337 | 492 | 466 | 619 | 2 | 649 | 359 | 306 |
| 2018 | 340 | 621 | 291 | 36 | 956 | 6 | 275 | 339 | 280 | 344 | 919 | 323 |
| 2019 | 2 | 643 | 325 | 33 | 373 | 3 | 472 | 189 | 327 | 335 | 359 | 336 |
| 2020 | 334 | 413 | 12 | 346 | 293 | 371 | 651 | 71 | 411 | 337 | 564 | 227 |
| 2021 | 471 | 44 | 56 | 7 | 667 | 32 | 268 | 334 | 344 | 324 | 336 | 9 |
| 2022 | 608 | 2 | 1 | 335 | 328 | 627 | 2 | 425 | 326 | 424 | 360 | 2 |
| 2023 | 366 | 336 | 353 | 4 | 525 | 119 | 684 | 332 | 337 | 3 | 2 | 338 |
| 2024 | 3 | |||||||||||
| - = No Data Reported; -- = Not Applicable; NA = Not Available; W = Withheld to avoid disclosure of individual company data. |
| Release Date: 3/29/2024 |
| Next Release Date: 4/30/2024 |