|
Download Data (XLS File) |
|
||||||||
|
||||||||
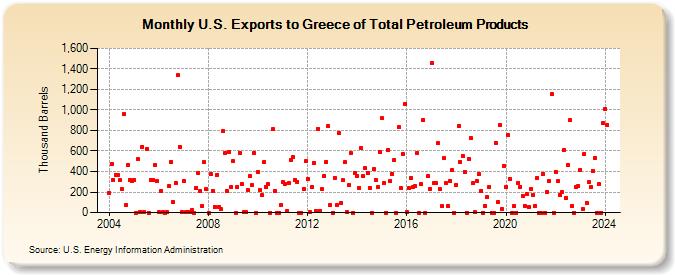
| U.S. Exports to Greece of Total Petroleum Products (Thousand Barrels) | ||||||||
| Year | Jan | Feb | Mar | Apr | May | Jun | Jul | Aug | Sep | Oct | Nov | Dec |
|---|---|---|---|---|---|---|---|---|---|---|---|---|
| 2004 | 194 | 472 | 316 | 368 | 365 | 316 | 228 | 956 | 72 | 465 | 320 | 311 |
| 2005 | 316 | 0 | 519 | 1 | 642 | 1 | 624 | 0 | 320 | 320 | 463 | 305 |
| 2006 | 1 | 214 | 2 | 0 | 2 | 258 | 497 | 100 | 292 | 1,337 | 642 | 2 |
| 2007 | 306 | 1 | 3 | 1 | 22 | 0 | 240 | 390 | 212 | 64 | 490 | 227 |
| 2008 | 0 | 372 | 214 | 58 | 364 | 56 | 30 | 792 | 579 | 209 | 586 | 247 |
| 2009 | 499 | 0 | 249 | 581 | 280 | 1 | 1 | 217 | 356 | 265 | 584 | 0 |
| 2010 | 398 | 216 | 170 | 497 | 247 | 274 | 0 | 810 | 212 | 0 | 0 | 72 |
| 2011 | 297 | 283 | 17 | 284 | 511 | 541 | 320 | 301 | 0 | 0 | 234 | 499 |
| 2012 | 326 | 1 | 248 | 487 | 13 | 819 | 16 | 226 | 354 | 496 | 840 | 75 |
| 2013 | 0 | 341 | 72 | 775 | 89 | 313 | 489 | 1 | 268 | 582 | 0 | 388 |
| 2014 | 357 | 242 | 629 | 352 | 431 | 386 | 242 | 0 | 422 | 319 | 248 | 591 |
| 2015 | 917 | 286 | 0 | 611 | 303 | 379 | 514 | 0 | 832 | 238 | 572 | 1,060 |
| 2016 | 1 | 238 | 336 | 250 | 254 | 578 | 0 | 276 | 904 | 0 | 352 | 232 |
| 2017 | 1,457 | 290 | 291 | 674 | 226 | 63 | 528 | 286 | 63 | 305 | 411 | 0 |
| 2018 | 271 | 845 | 494 | 553 | 399 | 0 | 526 | 726 | 285 | 1 | 309 | 377 |
| 2019 | 212 | 0 | 63 | 151 | 253 | 0 | 0 | 682 | 100 | 855 | 33 | 458 |
| 2020 | 250 | 753 | 330 | 0 | 63 | 0 | 292 | 253 | 159 | 66 | 180 | 55 |
| 2021 | 232 | 173 | 67 | 338 | 0 | 0 | 380 | 0 | 200 | 303 | 1,154 | 0 |
| 2022 | 399 | 303 | 170 | 198 | 605 | 143 | 462 | 901 | 67 | 0 | 249 | 258 |
| 2023 | 416 | 34 | 571 | 94 | 294 | 248 | 408 | 535 | 0 | 274 | 0 | 874 |
| 2024 | 1,007 | |||||||||||
| - = No Data Reported; -- = Not Applicable; NA = Not Available; W = Withheld to avoid disclosure of individual company data. |
| Release Date: 3/29/2024 |
| Next Release Date: 4/30/2024 |