|
Download Data (XLS File) |
|
||||||||
|
||||||||
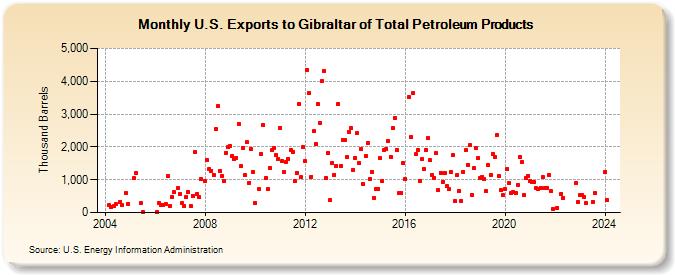
| U.S. Exports to Gibraltar of Total Petroleum Products (Thousand Barrels) | ||||||||
| Year | Jan | Feb | Mar | Apr | May | Jun | Jul | Aug | Sep | Oct | Nov | Dec |
|---|---|---|---|---|---|---|---|---|---|---|---|---|
| 2004 | 220 | 165 | 186 | 253 | 334 | 224 | 595 | 270 | ||||
| 2005 | 1,040 | 1,208 | 285 | 19 | ||||||||
| 2006 | 25 | 286 | 244 | 238 | 246 | 1,099 | 200 | 486 | 624 | 734 | ||
| 2007 | 552 | 277 | 200 | 474 | 628 | 206 | 511 | 1,850 | 558 | 468 | 1,017 | |
| 2008 | 955 | 1,600 | 1,320 | 1,280 | 1,152 | 2,534 | 3,239 | 1,268 | 1,121 | 960 | 1,827 | 1,985 |
| 2009 | 2,022 | 1,734 | 1,622 | 1,675 | 2,698 | 1,405 | 1,976 | 1,132 | 2,134 | 909 | 1,941 | 1,234 |
| 2010 | 286 | 704 | 1,787 | 2,660 | 1,047 | 716 | 1,370 | 1,891 | 1,971 | 1,739 | 1,624 | |
| 2011 | 2,587 | 1,564 | 1,225 | 1,555 | 1,624 | 1,899 | 1,858 | 947 | 1,220 | 3,320 | 1,073 | 1,987 |
| 2012 | 1,559 | 4,351 | 3,653 | 1,091 | 2,471 | 2,086 | 3,312 | 2,741 | 3,994 | 4,312 | 1,056 | 1,816 |
| 2013 | 382 | 1,508 | 1,157 | 1,432 | 3,308 | 1,424 | 2,211 | 2,197 | 1,687 | 2,465 | 2,573 | 1,310 |
| 2014 | 1,676 | 2,419 | 1,501 | 1,937 | 858 | 1,729 | 2,116 | 1,015 | 1,238 | 458 | 724 | 721 |
| 2015 | 1,649 | 946 | 1,911 | 1,929 | 2,186 | 1,702 | 2,576 | 2,890 | 1,900 | 585 | 605 | 1,515 |
| 2016 | 1,017 | 3,517 | 2,300 | 3,634 | 1,772 | 1,904 | 956 | 1,620 | 1,312 | 1,912 | 2,261 | |
| 2017 | 1,591 | 1,138 | 1,059 | 1,806 | 685 | 1,217 | 945 | 1,213 | 799 | 707 | 1,224 | 1,747 |
| 2018 | 351 | 1,150 | 651 | 349 | 1,249 | 1,894 | 1,462 | 2,043 | 535 | 1,346 | 1,979 | 1,660 |
| 2019 | 1,048 | 1,096 | 1,008 | 646 | 1,436 | 1,154 | 1,793 | 1,685 | 2,356 | 1,108 | 677 | 524 |
| 2020 | 704 | 1,317 | 907 | 582 | 620 | 594 | 849 | 1,696 | 1,544 | 534 | 1,058 | 1,121 |
| 2021 | 961 | 937 | 929 | 739 | 719 | 759 | 1,092 | 742 | 763 | 1,141 | 646 | 118 |
| 2022 | 151 | 573 | 444 | 899 | 336 | |||||||
| 2023 | 528 | 529 | 485 | 276 | 330 | 581 | ||||||
| 2024 | 1,247 | |||||||||||
| - = No Data Reported; -- = Not Applicable; NA = Not Available; W = Withheld to avoid disclosure of individual company data. |
| Release Date: 3/29/2024 |
| Next Release Date: 4/30/2024 |