|
Download Data (XLS File) |
|
||||||||
|
||||||||
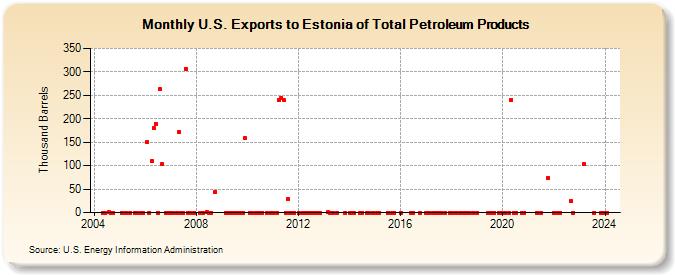
| U.S. Exports to Estonia of Total Petroleum Products (Thousand Barrels) | ||||||||
| Year | Jan | Feb | Mar | Apr | May | Jun | Jul | Aug | Sep | Oct | Nov | Dec |
|---|---|---|---|---|---|---|---|---|---|---|---|---|
| 2004 | 0 | 0 | 1 | 0 | 0 | |||||||
| 2005 | 0 | 0 | 0 | 0 | 0 | 0 | 0 | |||||
| 2006 | 150 | 0 | 110 | 180 | 189 | 0 | 263 | 103 | 0 | 0 | ||
| 2007 | 0 | 0 | 0 | 172 | 0 | 0 | 307 | 0 | 0 | 0 | ||
| 2008 | 0 | 0 | 1 | 0 | 0 | 44 | ||||||
| 2009 | 0 | 0 | 0 | 0 | 0 | 0 | 0 | 0 | 0 | 158 | ||
| 2010 | 0 | 0 | 0 | 0 | 0 | 0 | 0 | 0 | ||||
| 2011 | 0 | 0 | 240 | 245 | 239 | 0 | 28 | 0 | 0 | 0 | ||
| 2012 | 0 | 0 | 0 | 0 | 0 | 0 | 0 | 0 | 0 | 0 | ||
| 2013 | 1 | 0 | 0 | 0 | 0 | |||||||
| 2014 | 0 | 0 | 0 | 0 | 0 | 0 | 0 | 0 | ||||
| 2015 | 0 | 0 | 0 | 0 | 0 | |||||||
| 2016 | 0 | 0 | 0 | 0 | ||||||||
| 2017 | 0 | 0 | 0 | 0 | 0 | 0 | 0 | 0 | 0 | |||
| 2018 | 0 | 0 | 0 | 0 | 0 | 0 | 0 | 0 | ||||
| 2019 | 0 | 0 | 0 | 0 | 0 | 0 | 0 | |||||
| 2020 | 0 | 0 | 240 | 0 | 0 | 0 | 0 | |||||
| 2021 | 0 | 0 | 74 | |||||||||
| 2022 | 0 | 0 | 0 | 25 | 0 | |||||||
| 2023 | 103 | 0 | 0 | 0 | ||||||||
| 2024 | 0 | |||||||||||
| - = No Data Reported; -- = Not Applicable; NA = Not Available; W = Withheld to avoid disclosure of individual company data. |
| Release Date: 3/29/2024 |
| Next Release Date: 4/30/2024 |