|
Download Data (XLS File) |
|
||||||||
|
||||||||
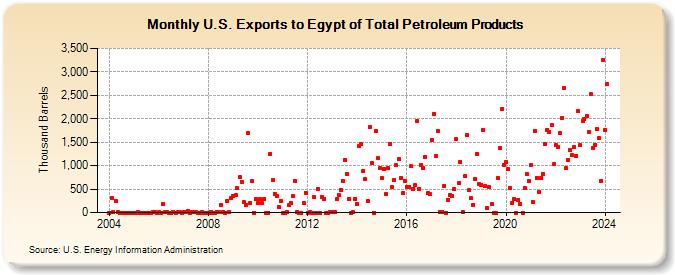
| U.S. Exports to Egypt of Total Petroleum Products (Thousand Barrels) | ||||||||
| Year | Jan | Feb | Mar | Apr | May | Jun | Jul | Aug | Sep | Oct | Nov | Dec |
|---|---|---|---|---|---|---|---|---|---|---|---|---|
| 2004 | 0 | 314 | 2 | 249 | 7 | 0 | 0 | 0 | 1 | 1 | 0 | 0 |
| 2005 | 0 | 0 | 8 | 0 | 1 | 1 | 1 | 1 | 1 | 12 | 3 | 0 |
| 2006 | 3 | 0 | 182 | 2 | 4 | 1 | 1 | 7 | 1 | 6 | 14 | 0 |
| 2007 | 10 | 9 | 34 | 1 | 8 | 2 | 8 | 1 | 1 | 7 | 1 | 0 |
| 2008 | 0 | 19 | 1 | 1 | 9 | 2 | 166 | 4 | 1 | 256 | 4 | 303 |
| 2009 | 363 | 372 | 516 | 750 | 661 | 218 | 169 | 1,689 | 199 | 664 | 0 | 281 |
| 2010 | 201 | 288 | 211 | 296 | 1 | 1 | 1,258 | 693 | 406 | 357 | 127 | 257 |
| 2011 | 1 | 1 | 2 | 152 | 209 | 346 | 669 | 2 | 0 | 1 | 199 | 427 |
| 2012 | 1 | 2 | 0 | 331 | 1 | 511 | 1 | 333 | 285 | 1 | 1 | 2 |
| 2013 | 4 | 2 | 289 | 381 | 490 | 663 | 1,131 | 821 | 285 | 1 | 2 | 284 |
| 2014 | 183 | 1,428 | 1,463 | 894 | 707 | 246 | 1,826 | 1,067 | 1 | 1,731 | 1,155 | 941 |
| 2015 | 741 | 936 | 406 | 955 | 1,466 | 539 | 695 | 1,009 | 1,144 | 739 | 407 | 675 |
| 2016 | 546 | 554 | 987 | 506 | 586 | 1,942 | 510 | 1,019 | 940 | 1,191 | 409 | 389 |
| 2017 | 1,541 | 2,110 | 1,197 | 1,731 | 2 | 14 | 564 | 1 | 275 | 374 | 343 | 495 |
| 2018 | 1,559 | 634 | 1,075 | 13 | 774 | 1,663 | 473 | 300 | 166 | 709 | 1,257 | 617 |
| 2019 | 593 | 1,755 | 559 | 102 | 544 | 186 | 1 | 1 | 739 | 1,374 | 2,212 | 1,022 |
| 2020 | 1,077 | 928 | 531 | 214 | 287 | 1 | 275 | 172 | 1 | 520 | 828 | 674 |
| 2021 | 1,008 | 223 | 1,738 | 739 | 446 | 735 | 823 | 1,472 | 1,764 | 1,721 | 1,861 | 1,026 |
| 2022 | 1,437 | 1,404 | 1,697 | 2,020 | 2,663 | 950 | 1,122 | 1,334 | 1,219 | 1,408 | 1,213 | 2,156 |
| 2023 | 1,434 | 1,949 | 1,996 | 2,051 | 1,710 | 2,525 | 1,373 | 1,446 | 1,776 | 1,583 | 678 | 3,260 |
| 2024 | 1,757 | |||||||||||
| - = No Data Reported; -- = Not Applicable; NA = Not Available; W = Withheld to avoid disclosure of individual company data. |
| Release Date: 3/29/2024 |
| Next Release Date: 4/30/2024 |