|
Download Data (XLS File) |
|
||||||||
|
||||||||
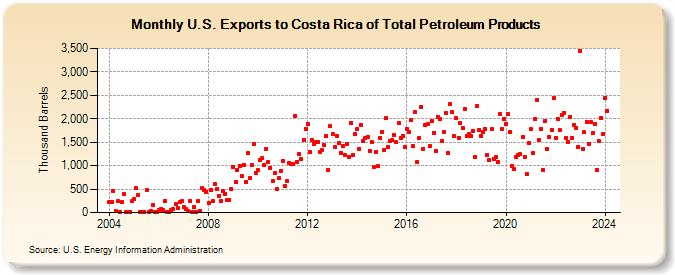
| U.S. Exports to Costa Rica of Total Petroleum Products (Thousand Barrels) | ||||||||
| Year | Jan | Feb | Mar | Apr | May | Jun | Jul | Aug | Sep | Oct | Nov | Dec |
|---|---|---|---|---|---|---|---|---|---|---|---|---|
| 2004 | 226 | 229 | 453 | 25 | 236 | 9 | 227 | 403 | 5 | 8 | 7 | 243 |
| 2005 | 281 | 514 | 382 | 13 | 14 | 14 | 483 | 13 | 28 | 164 | 21 | 15 |
| 2006 | 54 | 81 | 54 | 252 | 20 | 17 | 62 | 73 | 176 | 101 | 215 | 247 |
| 2007 | 123 | 70 | 32 | 257 | 12 | 114 | 9 | 250 | 36 | 523 | 486 | 447 |
| 2008 | 199 | 471 | 240 | 599 | 496 | 359 | 241 | 450 | 402 | 260 | 272 | 493 |
| 2009 | 970 | 654 | 917 | 993 | 787 | 1,023 | 656 | 1,266 | 731 | 1,018 | 1,452 | 846 |
| 2010 | 905 | 1,110 | 1,156 | 1,011 | 1,363 | 1,082 | 955 | 664 | 841 | 509 | 730 | 877 |
| 2011 | 1,106 | 563 | 666 | 1,065 | 1,031 | 1,031 | 2,059 | 1,068 | 1,240 | 1,141 | 1,557 | 1,792 |
| 2012 | 1,886 | 1,281 | 1,550 | 1,455 | 1,497 | 1,501 | 1,285 | 1,343 | 1,430 | 1,639 | 912 | 1,835 |
| 2013 | 1,683 | 1,401 | 1,642 | 1,484 | 1,265 | 1,423 | 1,235 | 1,468 | 1,187 | 1,916 | 1,235 | 1,670 |
| 2014 | 1,778 | 1,362 | 1,875 | 1,515 | 1,595 | 1,617 | 1,314 | 1,496 | 965 | 1,292 | 991 | 1,598 |
| 2015 | 1,719 | 1,332 | 2,011 | 1,400 | 1,518 | 1,549 | 1,644 | 1,505 | 1,919 | 1,596 | 1,636 | 1,394 |
| 2016 | 1,771 | 1,725 | 1,966 | 1,428 | 2,134 | 1,083 | 1,585 | 2,261 | 1,358 | 1,861 | 1,898 | 1,416 |
| 2017 | 1,944 | 1,704 | 1,314 | 2,044 | 1,987 | 1,536 | 1,708 | 2,124 | 1,277 | 2,309 | 2,134 | 1,626 |
| 2018 | 2,014 | 1,588 | 1,901 | 1,810 | 2,199 | 1,634 | 1,678 | 1,624 | 1,742 | 1,185 | 2,270 | 1,751 |
| 2019 | 1,630 | 1,719 | 1,789 | 1,228 | 1,120 | 1,775 | 1,151 | 1,176 | 1,078 | 2,099 | 1,774 | 1,985 |
| 2020 | 1,898 | 2,099 | 1,711 | 985 | 925 | 1,178 | 1,223 | 1,240 | 1,610 | 1,189 | 814 | 1,484 |
| 2021 | 1,779 | 1,280 | 1,986 | 2,390 | 1,553 | 1,782 | 904 | 1,945 | 1,364 | 1,617 | 1,769 | 2,439 |
| 2022 | 1,585 | 1,998 | 1,750 | 2,084 | 2,128 | 1,599 | 1,499 | 2,036 | 1,594 | 1,867 | 1,806 | 1,404 |
| 2023 | 3,454 | 1,365 | 1,711 | 1,939 | 1,471 | 1,923 | 1,691 | 1,883 | 905 | 1,515 | 2,020 | 1,679 |
| 2024 | 2,444 | |||||||||||
| - = No Data Reported; -- = Not Applicable; NA = Not Available; W = Withheld to avoid disclosure of individual company data. |
| Release Date: 3/29/2024 |
| Next Release Date: 4/30/2024 |