|
Download Data (XLS File) |
|
||||||||
|
||||||||
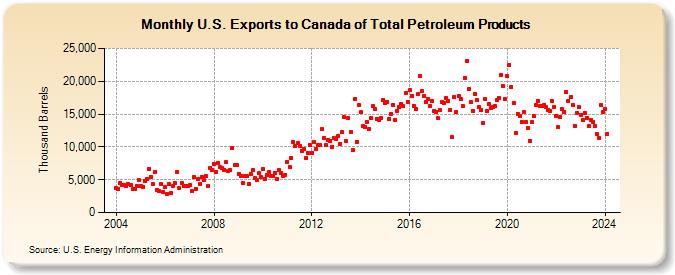
| U.S. Exports to Canada of Total Petroleum Products (Thousand Barrels) | ||||||||
| Year | Jan | Feb | Mar | Apr | May | Jun | Jul | Aug | Sep | Oct | Nov | Dec |
|---|---|---|---|---|---|---|---|---|---|---|---|---|
| 2004 | 3,683 | 3,573 | 4,548 | 4,267 | 4,125 | 3,985 | 4,361 | 4,151 | 3,566 | 3,541 | 4,011 | 4,989 |
| 2005 | 4,115 | 3,917 | 4,833 | 5,071 | 6,674 | 5,483 | 4,367 | 6,211 | 3,502 | 3,263 | 4,385 | 3,091 |
| 2006 | 3,846 | 2,884 | 4,353 | 2,983 | 4,015 | 4,495 | 6,205 | 3,668 | 4,452 | 4,040 | 4,074 | 4,021 |
| 2007 | 4,157 | 3,223 | 5,346 | 3,635 | 5,067 | 4,349 | 5,463 | 4,887 | 5,562 | 4,060 | 6,772 | 6,447 |
| 2008 | 7,397 | 6,201 | 7,615 | 6,897 | 6,742 | 6,540 | 7,651 | 6,304 | 6,421 | 9,808 | 7,273 | 7,214 |
| 2009 | 5,910 | 5,580 | 4,577 | 5,554 | 5,550 | 4,311 | 5,877 | 6,416 | 5,203 | 4,960 | 5,962 | 5,385 |
| 2010 | 6,689 | 5,091 | 5,712 | 6,151 | 5,546 | 5,629 | 6,066 | 5,179 | 6,504 | 6,022 | 5,612 | 5,763 |
| 2011 | 7,753 | 6,926 | 8,330 | 10,750 | 10,106 | 10,522 | 10,187 | 9,397 | 9,751 | 8,384 | 9,066 | 10,277 |
| 2012 | 9,128 | 10,706 | 9,744 | 10,228 | 10,258 | 12,689 | 11,325 | 10,284 | 11,009 | 10,867 | 10,059 | 11,327 |
| 2013 | 11,159 | 11,685 | 10,500 | 12,207 | 14,486 | 10,864 | 14,390 | 12,291 | 9,501 | 17,344 | 10,771 | 16,371 |
| 2014 | 15,346 | 13,227 | 13,067 | 13,856 | 12,748 | 14,402 | 16,202 | 15,803 | 14,195 | 14,095 | 14,380 | 17,174 |
| 2015 | 16,633 | 16,845 | 14,281 | 15,027 | 16,414 | 14,094 | 15,511 | 16,010 | 16,603 | 16,163 | 18,220 | 16,869 |
| 2016 | 18,610 | 17,822 | 16,298 | 15,773 | 17,988 | 20,776 | 18,462 | 17,700 | 16,788 | 17,218 | 16,231 | 17,030 |
| 2017 | 15,508 | 15,377 | 14,378 | 15,572 | 16,849 | 16,657 | 17,453 | 17,039 | 15,624 | 11,442 | 17,622 | 15,357 |
| 2018 | 17,688 | 17,256 | 16,176 | 20,552 | 23,061 | 18,746 | 16,825 | 15,541 | 18,105 | 17,199 | 16,059 | 15,603 |
| 2019 | 13,679 | 17,235 | 15,504 | 16,526 | 15,952 | 16,093 | 16,201 | 17,083 | 17,400 | 20,972 | 19,247 | 17,322 |
| 2020 | 20,745 | 22,450 | 19,106 | 16,684 | 12,058 | 15,072 | 14,680 | 13,857 | 15,269 | 13,729 | 12,867 | 10,949 |
| 2021 | 13,829 | 14,658 | 16,403 | 17,040 | 16,231 | 16,303 | 16,406 | 16,047 | 15,670 | 15,502 | 16,983 | 16,021 |
| 2022 | 14,731 | 12,979 | 14,497 | 15,736 | 15,325 | 18,289 | 16,979 | 17,538 | 16,399 | 13,206 | 15,135 | 16,129 |
| 2023 | 15,167 | 14,666 | 15,265 | 14,585 | 17,070 | 17,447 | 15,912 | 15,987 | 14,289 | 13,783 | 16,453 | 15,428 |
| 2024 | 15,830 | 12,015 | 13,871 | 15,637 | 14,296 | 11,502 | ||||||
| - = No Data Reported; -- = Not Applicable; NA = Not Available; W = Withheld to avoid disclosure of individual company data. |
| Release Date: 8/30/2024 |
| Next Release Date: 9/30/2024 |