|
Download Data (XLS File) |
|
||||||||
|
||||||||
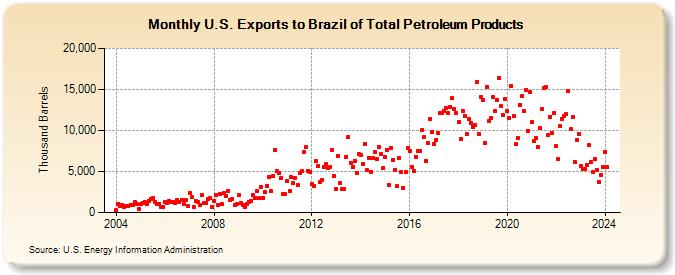
| U.S. Exports to Brazil of Total Petroleum Products (Thousand Barrels) | ||||||||
| Year | Jan | Feb | Mar | Apr | May | Jun | Jul | Aug | Sep | Oct | Nov | Dec |
|---|---|---|---|---|---|---|---|---|---|---|---|---|
| 2004 | 342 | 1,096 | 740 | 948 | 619 | 741 | 847 | 922 | 918 | 1,279 | 1,029 | 459 |
| 2005 | 1,009 | 1,134 | 1,282 | 1,031 | 1,442 | 1,657 | 1,810 | 1,340 | 1,082 | 1,082 | 682 | 730 |
| 2006 | 1,282 | 1,111 | 1,351 | 1,240 | 1,248 | 1,220 | 1,478 | 1,265 | 1,573 | 1,100 | 1,588 | 808 |
| 2007 | 2,399 | 1,864 | 650 | 1,383 | 1,260 | 923 | 2,128 | 1,106 | 1,144 | 1,620 | 1,785 | 676 |
| 2008 | 1,465 | 2,134 | 921 | 2,209 | 1,001 | 2,340 | 2,077 | 2,644 | 1,549 | 1,664 | 861 | 1,061 |
| 2009 | 2,104 | 1,168 | 942 | 629 | 1,073 | 1,320 | 1,413 | 2,098 | 1,773 | 2,580 | 1,726 | 3,162 |
| 2010 | 1,728 | 2,467 | 3,280 | 4,372 | 2,566 | 4,468 | 7,658 | 5,005 | 4,780 | 4,218 | 2,254 | 2,261 |
| 2011 | 3,882 | 2,595 | 4,278 | 3,609 | 4,190 | 3,378 | 4,830 | 5,122 | 7,317 | 7,977 | 5,100 | 4,953 |
| 2012 | 3,468 | 3,196 | 6,223 | 5,680 | 3,685 | 3,936 | 5,599 | 5,859 | 5,373 | 5,511 | 7,664 | 4,487 |
| 2013 | 2,890 | 6,862 | 3,575 | 2,887 | 2,927 | 6,829 | 9,229 | 6,073 | 5,537 | 6,342 | 4,853 | 7,182 |
| 2014 | 7,029 | 5,939 | 8,364 | 5,169 | 6,659 | 4,923 | 6,692 | 7,342 | 6,557 | 8,025 | 7,119 | 5,420 |
| 2015 | 6,773 | 7,666 | 3,411 | 7,859 | 6,405 | 5,239 | 3,178 | 6,689 | 4,913 | 3,017 | 4,886 | 7,827 |
| 2016 | 7,540 | 5,494 | 5,016 | 6,828 | 7,483 | 7,524 | 9,999 | 9,243 | 6,333 | 8,467 | 11,422 | 9,779 |
| 2017 | 8,367 | 8,887 | 9,676 | 12,160 | 12,189 | 12,432 | 12,701 | 12,169 | 12,909 | 13,913 | 12,564 | 12,111 |
| 2018 | 11,064 | 9,016 | 12,375 | 11,743 | 9,543 | 11,409 | 10,959 | 10,450 | 10,685 | 15,947 | 9,553 | 14,096 |
| 2019 | 13,688 | 8,480 | 15,309 | 11,133 | 11,574 | 14,093 | 12,385 | 13,708 | 16,391 | 12,967 | 11,877 | 13,798 |
| 2020 | 12,334 | 11,493 | 15,450 | 11,729 | 8,301 | 9,028 | 13,117 | 14,160 | 12,396 | 14,981 | 9,943 | 14,628 |
| 2021 | 10,991 | 8,697 | 9,038 | 8,042 | 10,263 | 12,559 | 15,211 | 15,277 | 9,472 | 11,698 | 9,725 | 12,172 |
| 2022 | 8,062 | 6,490 | 10,501 | 11,412 | 11,710 | 12,015 | 14,776 | 10,128 | 11,644 | 6,208 | 8,843 | 9,576 |
| 2023 | 5,724 | 5,260 | 5,251 | 5,775 | 8,198 | 6,163 | 4,963 | 6,513 | 5,196 | 3,773 | 4,538 | 5,611 |
| 2024 | 7,414 | |||||||||||
| - = No Data Reported; -- = Not Applicable; NA = Not Available; W = Withheld to avoid disclosure of individual company data. |
| Release Date: 3/29/2024 |
| Next Release Date: 4/30/2024 |