|
Download Data (XLS File) |
|
||||||||
|
||||||||
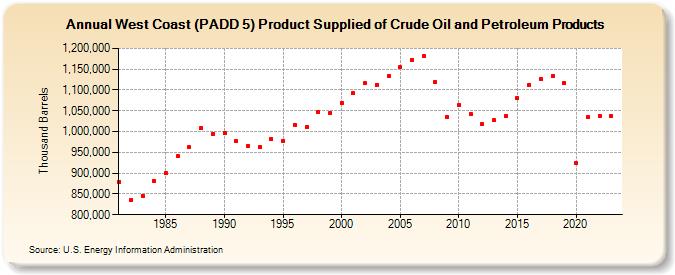
| West Coast (PADD 5) Product Supplied of Crude Oil and Petroleum Products (Thousand Barrels) | ||||||||
| Decade | Year-0 | Year-1 | Year-2 | Year-3 | Year-4 | Year-5 | Year-6 | Year-7 | Year-8 | Year-9 |
|---|---|---|---|---|---|---|---|---|---|---|
| 1980's | 879,780 | 834,792 | 845,773 | 881,659 | 899,626 | 940,221 | 961,892 | 1,008,776 | 994,289 | |
| 1990's | 996,977 | 977,743 | 965,791 | 962,951 | 981,858 | 978,396 | 1,015,854 | 1,011,423 | 1,046,736 | 1,044,183 |
| 2000's | 1,068,296 | 1,091,867 | 1,115,808 | 1,112,756 | 1,133,943 | 1,154,183 | 1,171,625 | 1,180,657 | 1,118,731 | 1,034,331 |
| 2010's | 1,063,509 | 1,041,683 | 1,017,283 | 1,026,796 | 1,037,140 | 1,080,087 | 1,112,002 | 1,127,390 | 1,133,234 | 1,117,140 |
| 2020's | 923,656 | 1,034,841 | 1,037,424 | 1,037,301 |
| - = No Data Reported; -- = Not Applicable; NA = Not Available; W = Withheld to avoid disclosure of individual company data. |
| Release Date: 3/29/2024 |
| Next Release Date: 8/30/2024 |