|
Download Data (XLS File) |
|
||||||||
|
||||||||
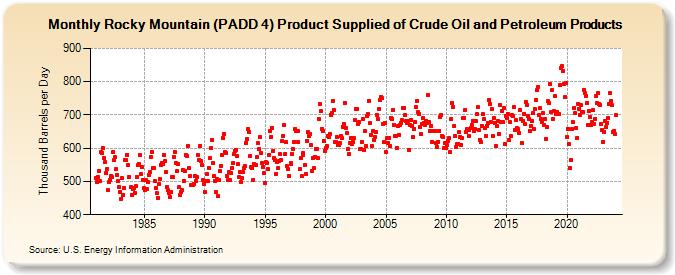
| Rocky Mountain (PADD 4) Product Supplied of Crude Oil and Petroleum Products (Thousand Barrels per Day) | ||||||||
| Year | Jan | Feb | Mar | Apr | May | Jun | Jul | Aug | Sep | Oct | Nov | Dec |
|---|---|---|---|---|---|---|---|---|---|---|---|---|
| 1981 | 510 | 499 | 513 | 530 | 501 | 589 | 587 | 600 | 570 | 558 | 525 | 537 |
| 1982 | 473 | 499 | 504 | 515 | 512 | 589 | 565 | 572 | 536 | 520 | 502 | 484 |
| 1983 | 469 | 448 | 509 | 460 | 480 | 564 | 564 | 581 | 549 | 514 | 483 | 460 |
| 1984 | 477 | 479 | 465 | 485 | 514 | 548 | 553 | 581 | 521 | 542 | 505 | 479 |
| 1985 | 475 | 503 | 478 | 498 | 519 | 527 | 573 | 589 | 541 | 541 | 500 | 481 |
| 1986 | 465 | 450 | 491 | 507 | 550 | 556 | 553 | 579 | 560 | 528 | 484 | 474 |
| 1987 | 465 | 452 | 468 | 513 | 512 | 575 | 588 | 555 | 530 | 553 | 482 | 458 |
| 1988 | 468 | 475 | 534 | 501 | 530 | 580 | 578 | 606 | 541 | 515 | 488 | 488 |
| 1989 | 489 | 493 | 517 | 502 | 513 | 580 | 564 | 607 | 562 | 549 | 505 | 492 |
| 1990 | 469 | 501 | 523 | 500 | 541 | 569 | 601 | 624 | 555 | 516 | 502 | 469 |
| 1991 | 506 | 455 | 505 | 531 | 547 | 580 | 630 | 642 | 588 | 585 | 515 | 503 |
| 1992 | 528 | 503 | 525 | 540 | 554 | 582 | 593 | 596 | 578 | 551 | 512 | 528 |
| 1993 | 497 | 509 | 527 | 539 | 545 | 617 | 628 | 658 | 650 | 576 | 544 | 541 |
| 1994 | 504 | 553 | 548 | 548 | 573 | 615 | 597 | 633 | 586 | 554 | 544 | 524 |
| 1995 | 495 | 557 | 556 | 536 | 581 | 651 | 634 | 662 | 593 | 570 | 563 | 523 |
| 1996 | 557 | 541 | 562 | 582 | 564 | 623 | 638 | 670 | 584 | 618 | 545 | 536 |
| 1997 | 516 | 554 | 551 | 582 | 597 | 620 | 658 | 651 | 651 | 618 | 537 | 570 |
| 1998 | 515 | 579 | 585 | 549 | 522 | 623 | 649 | 638 | 642 | 611 | 531 | 571 |
| 1999 | 540 | 574 | 597 | 597 | 571 | 689 | 734 | 711 | 659 | 652 | 623 | 593 |
| 2000 | 600 | 606 | 636 | 635 | 644 | 701 | 706 | 743 | 716 | 619 | 619 | 634 |
| 2001 | 610 | 610 | 616 | 636 | 631 | 665 | 673 | 737 | 662 | 647 | 599 | 583 |
| 2002 | 615 | 631 | 612 | 618 | 630 | 685 | 719 | 717 | 673 | 679 | 597 | 598 |
| 2003 | 619 | 688 | 595 | 652 | 607 | 696 | 704 | 743 | 675 | 641 | 607 | 651 |
| 2004 | 625 | 633 | 648 | 701 | 689 | 718 | 746 | 755 | 750 | 673 | 618 | 677 |
| 2005 | 589 | 631 | 616 | 630 | 608 | 692 | 689 | 715 | 671 | 636 | 638 | 602 |
| 2006 | 666 | 641 | 670 | 677 | 684 | 720 | 720 | 700 | 681 | 675 | 683 | 596 |
| 2007 | 669 | 686 | 666 | 633 | 659 | 679 | 724 | 743 | 708 | 704 | 665 | 642 |
| 2008 | 674 | 691 | 676 | 671 | 683 | 677 | 759 | 678 | 651 | 667 | 619 | 651 |
| 2009 | 653 | 652 | 617 | 604 | 620 | 652 | 695 | 699 | 636 | 634 | 601 | 615 |
| 2010 | 601 | 609 | 621 | 630 | 589 | 687 | 737 | 724 | 668 | 636 | 605 | 612 |
| 2011 | 614 | 648 | 634 | 611 | 631 | 692 | 691 | 715 | 648 | 657 | 637 | 656 |
| 2012 | 660 | 671 | 683 | 653 | 659 | 682 | 702 | 723 | 654 | 626 | 618 | 668 |
| 2013 | 702 | 687 | 662 | 637 | 666 | 676 | 744 | 734 | 680 | 718 | 638 | 691 |
| 2014 | 677 | 608 | 668 | 681 | 643 | 729 | 680 | 711 | 678 | 720 | 613 | 698 |
| 2015 | 691 | 704 | 625 | 679 | 638 | 699 | 697 | 725 | 654 | 684 | 660 | 658 |
| 2016 | 645 | 714 | 689 | 616 | 683 | 703 | 673 | 739 | 730 | 697 | 687 | 652 |
| 2017 | 666 | 681 | 706 | 659 | 717 | 746 | 774 | 784 | 699 | 720 | 687 | 679 |
| 2018 | 707 | 669 | 687 | 628 | 663 | 741 | 736 | 793 | 708 | 774 | 688 | 711 |
| 2019 | 757 | 704 | 709 | 704 | 703 | 789 | 841 | 847 | 833 | 793 | 753 | 795 |
| 2020 | 634 | 659 | 612 | 541 | 565 | 657 | 679 | 722 | 705 | 662 | 632 | 734 |
| 2021 | 719 | 701 | 729 | 708 | 709 | 776 | 765 | 757 | 736 | 669 | 712 | 695 |
| 2022 | 671 | 680 | 714 | 674 | 688 | 756 | 735 | 765 | 733 | 731 | 673 | 656 |
| 2023 | 618 | 650 | 683 | 663 | 677 | 690 | 732 | 765 | 743 | 729 | 648 | 653 |
| 2024 | 642 | |||||||||||
| - = No Data Reported; -- = Not Applicable; NA = Not Available; W = Withheld to avoid disclosure of individual company data. |
| Release Date: 3/29/2024 |
| Next Release Date: 4/30/2024 |