|
Download Data (XLS File) |
|
||||||||
|
||||||||
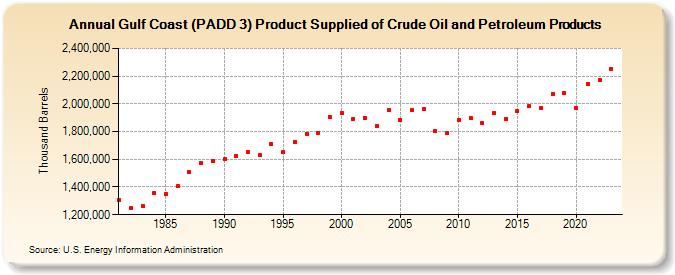
| Gulf Coast (PADD 3) Product Supplied of Crude Oil and Petroleum Products (Thousand Barrels) | ||||||||
| Decade | Year-0 | Year-1 | Year-2 | Year-3 | Year-4 | Year-5 | Year-6 | Year-7 | Year-8 | Year-9 |
|---|---|---|---|---|---|---|---|---|---|---|
| 1980's | 1,308,909 | 1,251,698 | 1,262,297 | 1,356,347 | 1,350,666 | 1,406,849 | 1,507,434 | 1,571,367 | 1,590,312 | |
| 1990's | 1,598,840 | 1,622,250 | 1,651,813 | 1,628,838 | 1,711,765 | 1,650,174 | 1,726,823 | 1,782,812 | 1,792,598 | 1,904,254 |
| 2000's | 1,935,339 | 1,894,004 | 1,897,215 | 1,840,054 | 1,953,129 | 1,885,891 | 1,953,171 | 1,963,566 | 1,806,972 | 1,788,014 |
| 2010's | 1,885,143 | 1,896,957 | 1,862,631 | 1,934,045 | 1,892,869 | 1,947,344 | 1,981,159 | 1,971,493 | 2,073,434 | 2,079,559 |
| 2020's | 1,968,356 | 2,143,968 | 2,173,860 | 2,252,466 |
| - = No Data Reported; -- = Not Applicable; NA = Not Available; W = Withheld to avoid disclosure of individual company data. |
| Release Date: 3/29/2024 |
| Next Release Date: 8/30/2024 |