|
Download Data (XLS File) |
|
||||||||
|
||||||||
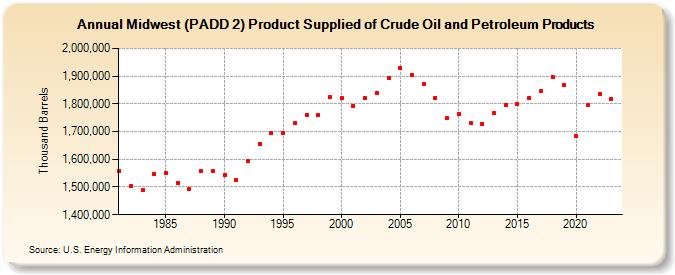
| Midwest (PADD 2) Product Supplied of Crude Oil and Petroleum Products (Thousand Barrels) | ||||||||
| Decade | Year-0 | Year-1 | Year-2 | Year-3 | Year-4 | Year-5 | Year-6 | Year-7 | Year-8 | Year-9 |
|---|---|---|---|---|---|---|---|---|---|---|
| 1980's | 1,557,772 | 1,501,875 | 1,490,800 | 1,547,238 | 1,549,578 | 1,514,908 | 1,493,510 | 1,558,822 | 1,556,967 | |
| 1990's | 1,544,887 | 1,523,561 | 1,592,780 | 1,655,292 | 1,695,214 | 1,694,699 | 1,732,219 | 1,761,241 | 1,759,457 | 1,823,251 |
| 2000's | 1,819,350 | 1,793,410 | 1,821,004 | 1,837,527 | 1,893,941 | 1,928,904 | 1,903,082 | 1,872,023 | 1,821,601 | 1,747,479 |
| 2010's | 1,764,679 | 1,732,053 | 1,728,560 | 1,765,439 | 1,796,921 | 1,797,770 | 1,820,059 | 1,846,556 | 1,897,739 | 1,866,450 |
| 2020's | 1,682,527 | 1,794,911 | 1,835,214 | 1,818,096 |
| - = No Data Reported; -- = Not Applicable; NA = Not Available; W = Withheld to avoid disclosure of individual company data. |
| Release Date: 3/29/2024 |
| Next Release Date: 8/30/2024 |