|
Download Data (XLS File) |
|
||||||||
|
||||||||
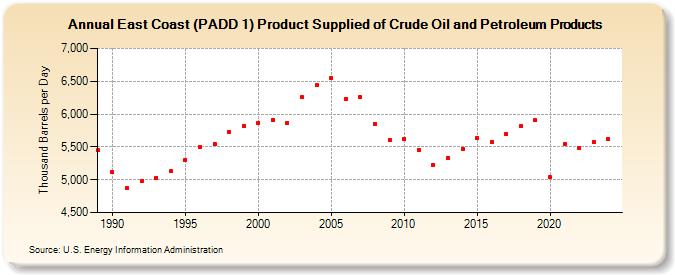
| East Coast (PADD 1) Product Supplied of Crude Oil and Petroleum Products (Thousand Barrels per Day) | ||||||||
| Decade | Year-0 | Year-1 | Year-2 | Year-3 | Year-4 | Year-5 | Year-6 | Year-7 | Year-8 | Year-9 |
|---|---|---|---|---|---|---|---|---|---|---|
| 1980's | 5,447 | |||||||||
| 1990's | 5,113 | 4,867 | 4,979 | 5,031 | 5,129 | 5,303 | 5,497 | 5,547 | 5,733 | 5,818 |
| 2000's | 5,868 | 5,916 | 5,869 | 6,253 | 6,435 | 6,545 | 6,236 | 6,256 | 5,852 | 5,611 |
| 2010's | 5,621 | 5,446 | 5,224 | 5,331 | 5,474 | 5,636 | 5,582 | 5,693 | 5,818 | 5,902 |
| 2020's | 5,037 | 5,540 | 5,478 | 5,564 |
| - = No Data Reported; -- = Not Applicable; NA = Not Available; W = Withheld to avoid disclosure of individual company data. |
| Release Date: 3/29/2024 |
| Next Release Date: 8/30/2024 |