|
Download Data (XLS File) |
|
||||||||
|
||||||||
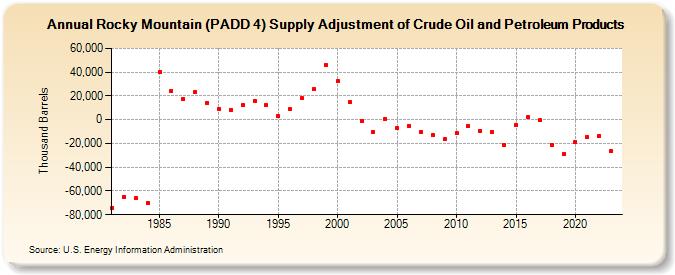
| Rocky Mountain (PADD 4) Supply Adjustment of Crude Oil and Petroleum Products (Thousand Barrels) | ||||||||
| Decade | Year-0 | Year-1 | Year-2 | Year-3 | Year-4 | Year-5 | Year-6 | Year-7 | Year-8 | Year-9 |
|---|---|---|---|---|---|---|---|---|---|---|
| 1980's | -74,205 | -64,673 | -66,288 | -70,040 | 40,031 | 24,307 | 17,275 | 23,382 | 14,411 | |
| 1990's | 9,028 | 8,513 | 11,932 | 15,560 | 12,233 | 3,047 | 8,572 | 17,957 | 25,733 | 46,128 |
| 2000's | 32,443 | 14,776 | -926 | -10,524 | 525 | -6,831 | -5,075 | -10,041 | -12,780 | -16,533 |
| 2010's | -11,504 | -5,507 | -9,215 | -10,104 | -21,152 | -4,301 | 1,884 | -491 | -21,086 | -28,769 |
| 2020's | -18,735 | -14,473 | -13,425 | -26,620 |
| - = No Data Reported; -- = Not Applicable; NA = Not Available; W = Withheld to avoid disclosure of individual company data. |
| Release Date: 3/29/2024 |
| Next Release Date: 8/30/2024 |