|
Download Data (XLS File) |
|
||||||||
|
||||||||
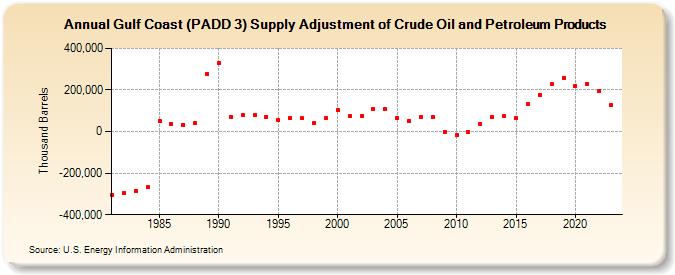
| Gulf Coast (PADD 3) Supply Adjustment of Crude Oil and Petroleum Products (Thousand Barrels) | ||||||||
| Decade | Year-0 | Year-1 | Year-2 | Year-3 | Year-4 | Year-5 | Year-6 | Year-7 | Year-8 | Year-9 |
|---|---|---|---|---|---|---|---|---|---|---|
| 1980's | -303,438 | -295,371 | -285,745 | -266,825 | 50,635 | 36,602 | 32,808 | 41,295 | 277,351 | |
| 1990's | 330,643 | 72,341 | 80,417 | 80,663 | 71,686 | 53,909 | 66,893 | 63,503 | 42,666 | 65,109 |
| 2000's | 102,350 | 73,839 | 75,655 | 109,155 | 106,084 | 65,859 | 52,305 | 68,033 | 67,942 | -295 |
| 2010's | -14,889 | -116 | 35,927 | 69,352 | 73,088 | 64,240 | 131,174 | 177,759 | 226,831 | 257,030 |
| 2020's | 220,208 | 230,998 | 196,458 | 126,246 |
| - = No Data Reported; -- = Not Applicable; NA = Not Available; W = Withheld to avoid disclosure of individual company data. |
| Release Date: 3/29/2024 |
| Next Release Date: 8/30/2024 |