|
Download Data (XLS File) |
|
||||||||
|
||||||||
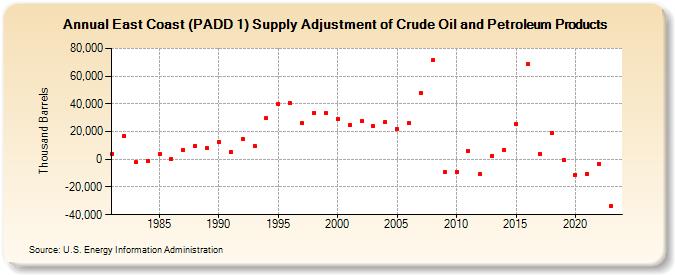
| East Coast (PADD 1) Supply Adjustment of Crude Oil and Petroleum Products (Thousand Barrels) | ||||||||
| Decade | Year-0 | Year-1 | Year-2 | Year-3 | Year-4 | Year-5 | Year-6 | Year-7 | Year-8 | Year-9 |
|---|---|---|---|---|---|---|---|---|---|---|
| 1980's | 4,042 | 16,730 | -2,185 | -1,041 | 3,948 | 87 | 6,794 | 9,624 | 7,915 | |
| 1990's | 12,754 | 5,275 | 14,981 | 9,464 | 29,584 | 39,976 | 40,270 | 26,033 | 33,579 | 33,229 |
| 2000's | 29,330 | 24,582 | 27,789 | 23,672 | 26,758 | 21,530 | 25,929 | 47,899 | 71,362 | -9,050 |
| 2010's | -9,031 | 6,245 | -10,959 | 2,497 | 7,015 | 25,304 | 68,449 | 4,150 | 19,108 | -513 |
| 2020's | -10,987 | -10,393 | -3,089 | -33,896 |
| - = No Data Reported; -- = Not Applicable; NA = Not Available; W = Withheld to avoid disclosure of individual company data. |
| Release Date: 3/29/2024 |
| Next Release Date: 8/30/2024 |