|
Download Data (XLS File) |
|
||||||||
|
||||||||
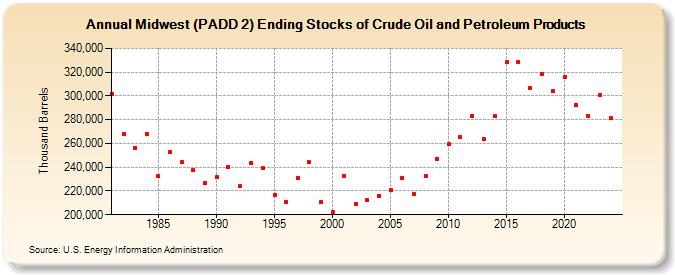
| Midwest (PADD 2) Ending Stocks of Crude Oil and Petroleum Products (Thousand Barrels) | ||||||||
| Decade | Year-0 | Year-1 | Year-2 | Year-3 | Year-4 | Year-5 | Year-6 | Year-7 | Year-8 | Year-9 |
|---|---|---|---|---|---|---|---|---|---|---|
| 1980's | 301,525 | 267,825 | 256,390 | 268,320 | 232,303 | 252,849 | 244,226 | 237,268 | 226,408 | |
| 1990's | 231,385 | 240,526 | 224,029 | 243,321 | 239,352 | 216,637 | 210,521 | 231,319 | 244,138 | 210,664 |
| 2000's | 202,283 | 232,725 | 209,096 | 212,373 | 215,815 | 220,796 | 230,943 | 217,717 | 232,711 | 247,158 |
| 2010's | 259,919 | 265,662 | 283,050 | 263,423 | 282,876 | 328,173 | 328,318 | 307,010 | 318,401 | 304,232 |
| 2020's | 315,728 | 292,050 | 282,831 | 300,161 |
| - = No Data Reported; -- = Not Applicable; NA = Not Available; W = Withheld to avoid disclosure of individual company data. |
| Release Date: 3/29/2024 |
| Next Release Date: 8/30/2024 |