|
Download Data (XLS File) |
|
||||||||
|
||||||||
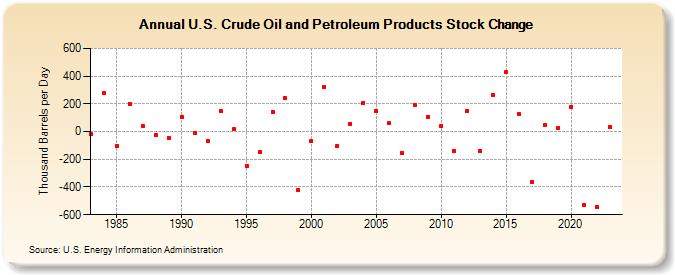
| U.S. Crude Oil and Petroleum Products Stock Change (Thousand Barrels per Day) | ||||||||
| Decade | Year-0 | Year-1 | Year-2 | Year-3 | Year-4 | Year-5 | Year-6 | Year-7 | Year-8 | Year-9 |
|---|---|---|---|---|---|---|---|---|---|---|
| 1980's | -20 | 280 | -103 | 202 | 41 | -28 | -43 | |||
| 1990's | 107 | -10 | -68 | 151 | 15 | -246 | -151 | 143 | 239 | -422 |
| 2000's | -69 | 325 | -105 | 56 | 209 | 146 | 59 | -152 | 195 | 107 |
| 2010's | 42 | -138 | 151 | -138 | 267 | 431 | 125 | -364 | 44 | 28 |
| 2020's | 176 | -527 | -542 | 36 |
| - = No Data Reported; -- = Not Applicable; NA = Not Available; W = Withheld to avoid disclosure of individual company data. |
| Release Date: 3/29/2024 |
| Next Release Date: 8/30/2024 |