|
Download Data (XLS File) |
|
||||||||
|
||||||||
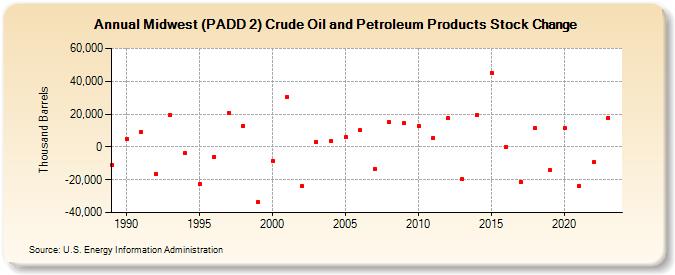
| Midwest (PADD 2) Crude Oil and Petroleum Products Stock Change (Thousand Barrels) | ||||||||
| Decade | Year-0 | Year-1 | Year-2 | Year-3 | Year-4 | Year-5 | Year-6 | Year-7 | Year-8 | Year-9 |
|---|---|---|---|---|---|---|---|---|---|---|
| 1980's | -10,860 | |||||||||
| 1990's | 4,977 | 9,141 | -16,497 | 19,292 | -3,969 | -22,715 | -6,116 | 20,798 | 12,819 | -33,474 |
| 2000's | -8,381 | 30,442 | -23,629 | 3,277 | 3,442 | 5,849 | 10,147 | -13,226 | 14,994 | 14,447 |
| 2010's | 12,779 | 5,502 | 17,388 | -19,627 | 19,452 | 45,297 | 145 | -21,307 | 11,391 | -14,166 |
| 2020's | 11,496 | -23,678 | -9,219 | 17,815 |
| - = No Data Reported; -- = Not Applicable; NA = Not Available; W = Withheld to avoid disclosure of individual company data. |
| Release Date: 3/29/2024 |
| Next Release Date: 8/30/2024 |