|
Download Data (XLS File) |
|
||||||||
|
||||||||
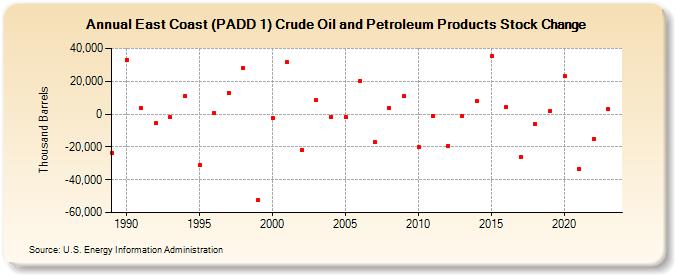
| East Coast (PADD 1) Crude Oil and Petroleum Products Stock Change (Thousand Barrels) | ||||||||
| Decade | Year-0 | Year-1 | Year-2 | Year-3 | Year-4 | Year-5 | Year-6 | Year-7 | Year-8 | Year-9 |
|---|---|---|---|---|---|---|---|---|---|---|
| 1980's | -23,417 | |||||||||
| 1990's | 32,959 | 3,681 | -5,584 | -1,922 | 10,905 | -31,119 | 541 | 13,072 | 27,950 | -52,180 |
| 2000's | -2,174 | 31,655 | -21,830 | 8,347 | -1,937 | -1,866 | 20,357 | -17,030 | 3,737 | 10,832 |
| 2010's | -20,241 | -890 | -19,427 | -1,097 | 7,712 | 35,463 | 4,174 | -26,197 | -6,123 | 1,810 |
| 2020's | 23,098 | -33,252 | -14,993 | 3,152 |
| - = No Data Reported; -- = Not Applicable; NA = Not Available; W = Withheld to avoid disclosure of individual company data. |
| Release Date: 3/29/2024 |
| Next Release Date: 8/30/2024 |