|
Download Data (XLS File) |
|
||||||||
|
||||||||
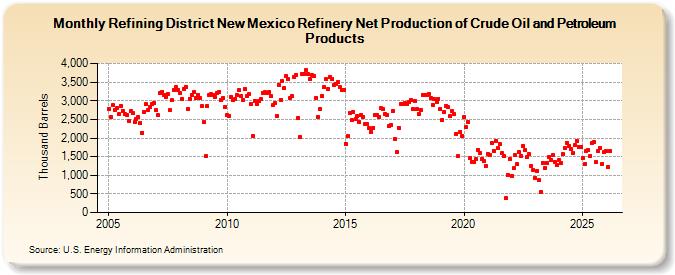
| Refining District New Mexico Refinery Net Production of Crude Oil and Petroleum Products (Thousand Barrels) | ||||||||
| Year | Jan | Feb | Mar | Apr | May | Jun | Jul | Aug | Sep | Oct | Nov | Dec |
|---|---|---|---|---|---|---|---|---|---|---|---|---|
| 2005 | 2,786 | 2,562 | 2,875 | 2,754 | 2,797 | 2,632 | 2,864 | 2,731 | 2,642 | 2,629 | 2,460 | 2,712 |
| 2006 | 2,659 | 2,432 | 2,512 | 2,565 | 2,407 | 2,143 | 2,701 | 2,906 | 2,754 | 2,830 | 2,904 | 2,951 |
| 2007 | 2,744 | 2,606 | 3,198 | 3,244 | 3,163 | 3,094 | 3,182 | 2,741 | 3,010 | 3,291 | 3,364 | 3,291 |
| 2008 | 3,220 | 3,056 | 3,322 | 3,377 | 2,783 | 3,055 | 3,159 | 3,223 | 3,079 | 3,164 | 3,073 | 2,852 |
| 2009 | 2,420 | 1,509 | 2,858 | 3,151 | 3,169 | 3,151 | 3,109 | 3,212 | 3,240 | 3,030 | 3,079 | 2,840 |
| 2010 | 2,618 | 2,589 | 3,108 | 3,014 | 3,035 | 3,145 | 3,293 | 3,123 | 3,030 | 3,311 | 3,139 | 3,181 |
| 2011 | 2,900 | 2,045 | 2,993 | 2,913 | 2,985 | 3,043 | 3,217 | 3,223 | 3,196 | 3,231 | 3,130 | 2,874 |
| 2012 | 2,939 | 2,598 | 3,427 | 3,033 | 3,521 | 3,339 | 3,662 | 3,573 | 3,077 | 3,118 | 3,649 | 3,696 |
| 2013 | 2,534 | 2,017 | 3,721 | 3,724 | 3,813 | 3,708 | 3,581 | 3,689 | 3,661 | 3,071 | 2,574 | 2,785 |
| 2014 | 3,122 | 3,365 | 3,575 | 3,315 | 3,632 | 3,585 | 3,435 | 3,459 | 3,490 | 3,357 | 3,283 | 3,294 |
| 2015 | 1,849 | 2,041 | 2,660 | 2,478 | 2,704 | 2,510 | 2,578 | 2,430 | 2,611 | 2,567 | 2,377 | 2,368 |
| 2016 | 2,258 | 2,168 | 2,280 | 2,625 | 2,614 | 2,572 | 2,797 | 2,769 | 2,649 | 2,626 | 2,322 | 2,341 |
| 2017 | 2,720 | 1,980 | 1,624 | 2,282 | 2,912 | 2,923 | 2,927 | 2,904 | 2,971 | 3,026 | 2,783 | 2,998 |
| 2018 | 2,770 | 2,648 | 2,764 | 3,162 | 3,154 | 3,150 | 3,192 | 3,072 | 2,895 | 3,037 | 2,967 | 3,054 |
| 2019 | 2,779 | 2,487 | 2,711 | 2,869 | 2,823 | 2,584 | 2,716 | 2,638 | 2,118 | 1,505 | 2,174 | 2,051 |
| 2020 | 2,553 | 2,289 | 2,423 | 1,462 | 1,365 | 1,351 | 1,437 | 1,687 | 1,605 | 1,437 | 1,377 | 1,250 |
| 2021 | 1,580 | 1,548 | 1,875 | 1,664 | 1,924 | 1,736 | 1,844 | 1,585 | 1,530 | 389 | 1,010 | 1,447 |
| 2022 | 987 | 1,185 | 1,535 | 1,293 | 1,615 | 1,524 | 1,793 | 1,674 | 1,479 | 1,575 | 1,240 | 1,143 |
| 2023 | 943 | 1,125 | 873 | 555 | 1,326 | 1,206 | 1,340 | 1,498 | 1,416 | 1,536 | 1,361 | 1,281 |
| 2024 | 1,397 | |||||||||||
| - = No Data Reported; -- = Not Applicable; NA = Not Available; W = Withheld to avoid disclosure of individual company data. |
| Release Date: 3/29/2024 |
| Next Release Date: 4/30/2024 |