|
Download Data (XLS File) |
|
||||||||
|
||||||||
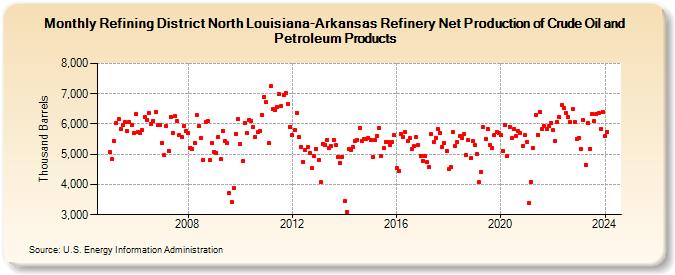
| Refining District North Louisiana-Arkansas Refinery Net Production of Crude Oil and Petroleum Products (Thousand Barrels) | ||||||||
| Year | Jan | Feb | Mar | Apr | May | Jun | Jul | Aug | Sep | Oct | Nov | Dec |
|---|---|---|---|---|---|---|---|---|---|---|---|---|
| 2005 | 5,073 | 4,828 | 5,431 | 6,028 | 6,162 | 5,829 | 5,960 | 6,050 | 5,764 | 6,057 | 5,982 | 5,715 |
| 2006 | 6,321 | 5,729 | 5,686 | 5,786 | 6,236 | 6,130 | 6,354 | 6,015 | 6,112 | 6,398 | 5,956 | 5,960 |
| 2007 | 5,383 | 4,968 | 5,941 | 5,106 | 6,221 | 5,711 | 6,263 | 6,096 | 5,624 | 5,560 | 5,939 | 5,755 |
| 2008 | 5,696 | 5,217 | 5,186 | 5,383 | 6,311 | 5,919 | 5,544 | 4,805 | 6,058 | 6,102 | 4,802 | 5,371 |
| 2009 | 5,080 | 5,041 | 5,578 | 4,829 | 5,784 | 5,426 | 5,364 | 3,702 | 3,422 | 3,885 | 5,681 | 6,151 |
| 2010 | 5,332 | 4,766 | 6,025 | 5,700 | 6,134 | 6,114 | 5,897 | 5,571 | 5,729 | 5,753 | 6,299 | 6,892 |
| 2011 | 6,714 | 5,383 | 7,241 | 6,494 | 6,446 | 6,561 | 6,978 | 6,582 | 6,960 | 7,029 | 6,652 | 5,907 |
| 2012 | 5,625 | 5,805 | 6,373 | 5,564 | 5,254 | 4,755 | 5,155 | 5,227 | 5,046 | 4,553 | 4,948 | 5,188 |
| 2013 | 4,810 | 4,068 | 5,339 | 5,320 | 5,483 | 5,210 | 5,263 | 5,483 | 5,308 | 4,913 | 4,714 | 4,923 |
| 2014 | 3,447 | 3,101 | 5,184 | 5,142 | 5,229 | 5,445 | 5,475 | 5,865 | 5,445 | 5,494 | 5,507 | 5,551 |
| 2015 | 5,474 | 4,900 | 5,463 | 5,616 | 5,867 | 4,952 | 5,193 | 5,409 | 5,412 | 5,318 | 5,402 | 5,624 |
| 2016 | 4,536 | 4,434 | 5,667 | 5,571 | 5,723 | 5,425 | 5,525 | 5,157 | 5,262 | 5,561 | 5,303 | 4,943 |
| 2017 | 4,785 | 4,956 | 4,731 | 4,588 | 5,658 | 5,407 | 5,549 | 5,823 | 5,696 | 5,247 | 5,366 | 5,115 |
| 2018 | 4,511 | 4,570 | 5,745 | 5,275 | 5,392 | 5,593 | 5,540 | 5,655 | 4,983 | 5,465 | 4,859 | 5,421 |
| 2019 | 5,295 | 5,002 | 4,071 | 4,419 | 5,887 | 5,494 | 5,841 | 5,299 | 5,195 | 5,627 | 5,742 | 5,710 |
| 2020 | 5,626 | 5,107 | 5,957 | 4,955 | 5,912 | 5,535 | 5,828 | 5,612 | 5,758 | 5,697 | 5,270 | 5,619 |
| 2021 | 5,411 | 3,373 | 4,077 | 5,205 | 6,303 | 5,647 | 6,388 | 5,820 | 5,925 | 5,828 | 5,937 | 6,025 |
| 2022 | 5,785 | 5,432 | 6,065 | 6,215 | 6,628 | 6,539 | 6,363 | 6,236 | 6,049 | 6,495 | 6,064 | 5,497 |
| 2023 | 5,547 | 5,178 | 6,117 | 4,652 | 6,019 | 5,188 | 6,339 | 6,091 | 6,335 | 6,369 | 5,838 | 6,402 |
| 2024 | 5,609 | |||||||||||
| - = No Data Reported; -- = Not Applicable; NA = Not Available; W = Withheld to avoid disclosure of individual company data. |
| Release Date: 3/29/2024 |
| Next Release Date: 4/30/2024 |