|
Download Data (XLS File) |
|
||||||||
|
||||||||
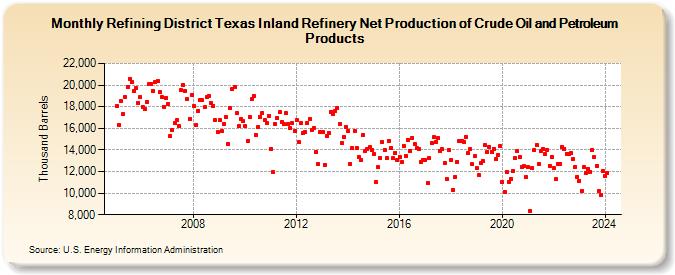
| Refining District Texas Inland Refinery Net Production of Crude Oil and Petroleum Products (Thousand Barrels) | ||||||||
| Year | Jan | Feb | Mar | Apr | May | Jun | Jul | Aug | Sep | Oct | Nov | Dec |
|---|---|---|---|---|---|---|---|---|---|---|---|---|
| 2005 | 18,063 | 16,300 | 18,495 | 17,288 | 18,880 | 19,838 | 20,602 | 20,242 | 19,464 | 19,735 | 18,378 | 18,918 |
| 2006 | 18,013 | 17,764 | 18,456 | 20,093 | 20,140 | 19,457 | 20,261 | 20,380 | 19,346 | 18,891 | 18,001 | 18,819 |
| 2007 | 18,258 | 15,246 | 15,819 | 16,466 | 16,731 | 16,212 | 19,519 | 19,989 | 19,473 | 18,684 | 16,894 | 19,113 |
| 2008 | 18,044 | 16,310 | 17,643 | 18,600 | 18,575 | 17,942 | 18,914 | 19,007 | 18,316 | 18,105 | 16,741 | 15,703 |
| 2009 | 16,752 | 15,743 | 16,418 | 17,043 | 14,564 | 17,899 | 19,623 | 19,783 | 17,379 | 16,176 | 16,894 | 16,640 |
| 2010 | 16,171 | 14,824 | 17,029 | 18,671 | 19,019 | 15,362 | 16,099 | 17,075 | 17,420 | 16,787 | 16,453 | 17,139 |
| 2011 | 14,088 | 11,927 | 16,416 | 16,971 | 17,486 | 16,598 | 16,354 | 17,392 | 16,382 | 15,994 | 16,480 | 15,742 |
| 2012 | 16,756 | 14,693 | 16,445 | 15,567 | 15,653 | 16,496 | 16,867 | 15,835 | 16,045 | 13,811 | 12,694 | 15,626 |
| 2013 | 15,616 | 12,636 | 15,298 | 15,607 | 17,509 | 17,280 | 17,633 | 17,887 | 16,358 | 14,618 | 15,219 | 16,141 |
| 2014 | 15,791 | 12,739 | 14,171 | 15,783 | 14,206 | 13,308 | 13,074 | 15,392 | 13,902 | 14,080 | 14,261 | 13,982 |
| 2015 | 13,599 | 11,009 | 12,383 | 13,259 | 14,740 | 14,029 | 13,225 | 14,853 | 14,204 | 13,210 | 13,716 | 13,079 |
| 2016 | 13,333 | 12,858 | 14,352 | 13,441 | 14,962 | 13,932 | 15,131 | 14,567 | 14,165 | 14,103 | 12,906 | 13,096 |
| 2017 | 13,067 | 10,936 | 13,243 | 14,597 | 15,174 | 14,743 | 15,102 | 13,872 | 14,049 | 12,812 | 11,350 | 13,950 |
| 2018 | 13,109 | 10,316 | 11,512 | 12,918 | 14,841 | 14,862 | 14,762 | 15,237 | 13,732 | 14,039 | 12,667 | 13,403 |
| 2019 | 12,312 | 11,644 | 12,775 | 13,014 | 14,415 | 13,800 | 14,298 | 13,838 | 14,128 | 13,141 | 13,522 | 14,320 |
| 2020 | 11,043 | 10,103 | 11,940 | 11,055 | 11,320 | 12,055 | 13,247 | 13,916 | 13,364 | 12,414 | 12,473 | 11,478 |
| 2021 | 12,410 | 8,322 | 12,313 | 13,980 | 14,465 | 12,723 | 13,869 | 14,069 | 13,626 | 14,035 | 12,554 | 13,367 |
| 2022 | 12,314 | 11,263 | 12,729 | 12,710 | 14,294 | 14,105 | 13,625 | 13,612 | 13,683 | 13,156 | 12,427 | 11,493 |
| 2023 | 11,159 | 10,219 | 12,430 | 11,851 | 12,270 | 11,974 | 14,010 | 13,303 | 12,554 | 10,209 | 9,834 | 12,043 |
| 2024 | 11,538 | |||||||||||
| - = No Data Reported; -- = Not Applicable; NA = Not Available; W = Withheld to avoid disclosure of individual company data. |
| Release Date: 3/29/2024 |
| Next Release Date: 4/30/2024 |