|
Download Data (XLS File) |
|
||||||||
|
||||||||
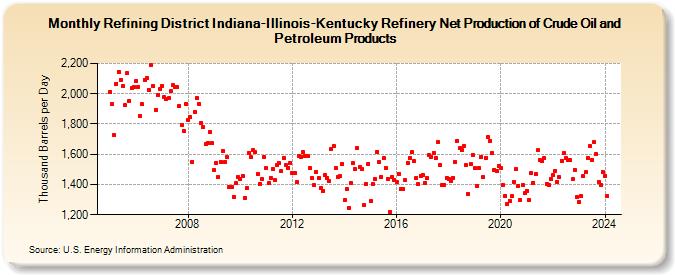
| Refining District Indiana-Illinois-Kentucky Refinery Net Production of Crude Oil and Petroleum Products (Thousand Barrels per Day) | ||||||||
| Year | Jan | Feb | Mar | Apr | May | Jun | Jul | Aug | Sep | Oct | Nov | Dec |
|---|---|---|---|---|---|---|---|---|---|---|---|---|
| 2005 | 2,012 | 1,929 | 1,726 | 2,067 | 2,146 | 2,093 | 2,052 | 1,923 | 2,135 | 1,951 | 2,038 | 2,042 |
| 2006 | 2,084 | 2,047 | 1,853 | 1,930 | 2,092 | 2,104 | 2,025 | 2,189 | 2,052 | 1,895 | 1,993 | 2,031 |
| 2007 | 2,053 | 1,976 | 1,963 | 1,969 | 2,015 | 2,055 | 2,042 | 2,043 | 1,922 | 1,796 | 1,754 | 1,933 |
| 2008 | 1,829 | 1,844 | 1,551 | 1,881 | 1,974 | 1,933 | 1,807 | 1,777 | 1,667 | 1,674 | 1,748 | 1,671 |
| 2009 | 1,495 | 1,545 | 1,448 | 1,551 | 1,624 | 1,549 | 1,579 | 1,382 | 1,385 | 1,318 | 1,408 | 1,449 |
| 2010 | 1,434 | 1,456 | 1,309 | 1,377 | 1,611 | 1,579 | 1,629 | 1,612 | 1,470 | 1,404 | 1,435 | 1,583 |
| 2011 | 1,509 | 1,408 | 1,444 | 1,505 | 1,432 | 1,529 | 1,540 | 1,487 | 1,574 | 1,528 | 1,511 | 1,543 |
| 2012 | 1,474 | 1,478 | 1,414 | 1,588 | 1,581 | 1,614 | 1,586 | 1,587 | 1,509 | 1,443 | 1,394 | 1,482 |
| 2013 | 1,444 | 1,378 | 1,360 | 1,460 | 1,446 | 1,420 | 1,633 | 1,656 | 1,508 | 1,451 | 1,455 | 1,538 |
| 2014 | 1,297 | 1,369 | 1,247 | 1,410 | 1,539 | 1,501 | 1,638 | 1,515 | 1,499 | 1,261 | 1,404 | 1,538 |
| 2015 | 1,288 | 1,405 | 1,438 | 1,617 | 1,548 | 1,450 | 1,572 | 1,511 | 1,434 | 1,220 | 1,450 | 1,431 |
| 2016 | 1,416 | 1,471 | 1,367 | 1,369 | 1,427 | 1,541 | 1,574 | 1,612 | 1,553 | 1,444 | 1,400 | 1,456 |
| 2017 | 1,462 | 1,410 | 1,441 | 1,592 | 1,581 | 1,610 | 1,576 | 1,679 | 1,530 | 1,397 | 1,398 | 1,446 |
| 2018 | 1,435 | 1,424 | 1,445 | 1,550 | 1,689 | 1,640 | 1,626 | 1,656 | 1,526 | 1,338 | 1,533 | 1,596 |
| 2019 | 1,506 | 1,388 | 1,509 | 1,581 | 1,448 | 1,578 | 1,713 | 1,689 | 1,608 | 1,498 | 1,488 | 1,525 |
| 2020 | 1,509 | 1,397 | 1,324 | 1,273 | 1,293 | 1,321 | 1,419 | 1,502 | 1,393 | 1,297 | 1,396 | 1,342 |
| 2021 | 1,359 | 1,298 | 1,477 | 1,413 | 1,468 | 1,626 | 1,561 | 1,552 | 1,575 | 1,402 | 1,396 | 1,437 |
| 2022 | 1,461 | 1,490 | 1,419 | 1,449 | 1,557 | 1,607 | 1,572 | 1,562 | 1,559 | 1,434 | 1,498 | 1,314 |
| 2023 | 1,285 | 1,321 | 1,453 | 1,480 | 1,575 | 1,652 | 1,563 | 1,679 | 1,599 | 1,417 | 1,399 | 1,483 |
| 2024 | 1,459 | |||||||||||
| - = No Data Reported; -- = Not Applicable; NA = Not Available; W = Withheld to avoid disclosure of individual company data. |
| Release Date: 3/29/2024 |
| Next Release Date: 4/30/2024 |