|
Download Data (XLS File) |
|
||||||||
|
||||||||
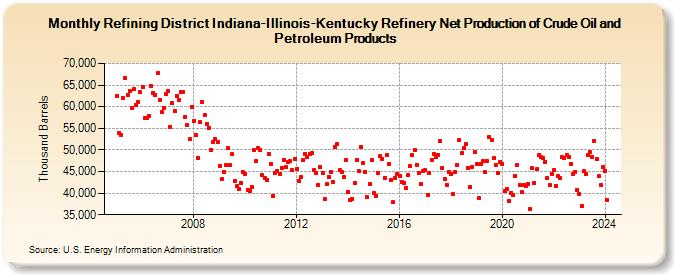
| Refining District Indiana-Illinois-Kentucky Refinery Net Production of Crude Oil and Petroleum Products (Thousand Barrels) | ||||||||
| Year | Jan | Feb | Mar | Apr | May | Jun | Jul | Aug | Sep | Oct | Nov | Dec |
|---|---|---|---|---|---|---|---|---|---|---|---|---|
| 2005 | 62,381 | 54,006 | 53,509 | 62,024 | 66,534 | 62,798 | 63,598 | 59,601 | 64,040 | 60,479 | 61,144 | 63,317 |
| 2006 | 64,603 | 57,306 | 57,432 | 57,895 | 64,839 | 63,128 | 62,787 | 67,850 | 61,561 | 58,756 | 59,803 | 62,962 |
| 2007 | 63,651 | 55,326 | 60,846 | 59,066 | 62,453 | 61,655 | 63,315 | 63,344 | 57,670 | 55,663 | 52,606 | 59,920 |
| 2008 | 56,712 | 53,476 | 48,071 | 56,422 | 61,191 | 58,001 | 56,021 | 55,099 | 50,000 | 51,899 | 52,450 | 51,816 |
| 2009 | 46,360 | 43,250 | 44,896 | 46,526 | 50,329 | 46,469 | 48,963 | 42,833 | 41,539 | 40,844 | 42,246 | 44,915 |
| 2010 | 44,445 | 40,754 | 40,581 | 41,300 | 49,928 | 47,373 | 50,504 | 49,966 | 44,112 | 43,514 | 43,049 | 49,084 |
| 2011 | 46,776 | 39,417 | 44,752 | 45,157 | 44,390 | 45,878 | 47,745 | 46,084 | 47,231 | 47,358 | 45,335 | 47,839 |
| 2012 | 45,679 | 42,874 | 43,820 | 47,640 | 49,017 | 48,406 | 49,164 | 49,211 | 45,273 | 44,744 | 41,805 | 45,933 |
| 2013 | 44,753 | 38,583 | 42,149 | 43,790 | 44,823 | 42,587 | 50,628 | 51,337 | 45,254 | 44,972 | 43,639 | 47,669 |
| 2014 | 40,218 | 38,339 | 38,667 | 42,313 | 47,695 | 45,024 | 50,770 | 46,950 | 44,975 | 39,081 | 42,112 | 47,682 |
| 2015 | 39,923 | 39,339 | 44,572 | 48,496 | 47,998 | 43,503 | 48,730 | 46,842 | 43,006 | 37,833 | 43,509 | 44,353 |
| 2016 | 43,898 | 42,662 | 42,370 | 41,083 | 44,222 | 46,222 | 48,789 | 49,985 | 46,590 | 44,760 | 41,997 | 45,143 |
| 2017 | 45,323 | 39,477 | 44,672 | 47,769 | 49,009 | 48,290 | 48,852 | 52,050 | 45,895 | 43,302 | 41,945 | 44,835 |
| 2018 | 44,471 | 39,860 | 44,795 | 46,499 | 52,363 | 49,214 | 50,415 | 51,351 | 45,781 | 41,463 | 45,999 | 49,487 |
| 2019 | 46,684 | 38,853 | 46,794 | 47,415 | 44,875 | 47,331 | 53,097 | 52,374 | 48,235 | 46,451 | 44,650 | 47,278 |
| 2020 | 46,793 | 40,514 | 41,032 | 38,177 | 40,097 | 39,630 | 43,980 | 46,576 | 41,783 | 40,205 | 41,867 | 41,605 |
| 2021 | 42,116 | 36,337 | 45,787 | 42,401 | 45,498 | 48,770 | 48,393 | 48,104 | 47,244 | 43,469 | 41,894 | 44,538 |
| 2022 | 45,296 | 41,706 | 44,004 | 43,474 | 48,256 | 48,198 | 48,739 | 48,427 | 46,755 | 44,458 | 44,943 | 40,721 |
| 2023 | 39,846 | 36,999 | 45,037 | 44,397 | 48,828 | 49,564 | 48,448 | 52,062 | 47,971 | 43,923 | 41,979 | 45,962 |
| 2024 | 45,219 | |||||||||||
| - = No Data Reported; -- = Not Applicable; NA = Not Available; W = Withheld to avoid disclosure of individual company data. |
| Release Date: 3/29/2024 |
| Next Release Date: 4/30/2024 |