|
Download Data (XLS File) |
|
||||||||
|
||||||||
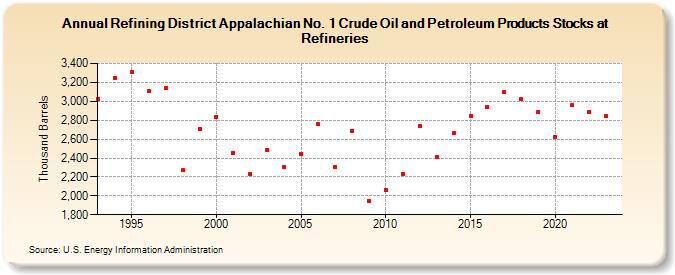
| Refining District Appalachian No. 1 Crude Oil and Petroleum Products Stocks at Refineries (Thousand Barrels) | ||||||||
| Decade | Year-0 | Year-1 | Year-2 | Year-3 | Year-4 | Year-5 | Year-6 | Year-7 | Year-8 | Year-9 |
|---|---|---|---|---|---|---|---|---|---|---|
| 1990's | 3,026 | 3,251 | 3,307 | 3,111 | 3,143 | 2,268 | 2,712 | |||
| 2000's | 2,831 | 2,455 | 2,231 | 2,483 | 2,300 | 2,446 | 2,762 | 2,309 | 2,687 | 1,950 |
| 2010's | 2,064 | 2,235 | 2,737 | 2,410 | 2,663 | 2,840 | 2,938 | 3,094 | 3,022 | 2,890 |
| 2020's | 2,626 | 2,959 | 2,886 | 2,844 |
| - = No Data Reported; -- = Not Applicable; NA = Not Available; W = Withheld to avoid disclosure of individual company data. |
| Release Date: 3/29/2024 |
| Next Release Date: 8/30/2024 |