|
Download Data (XLS File) |
|
||||||||
|
||||||||
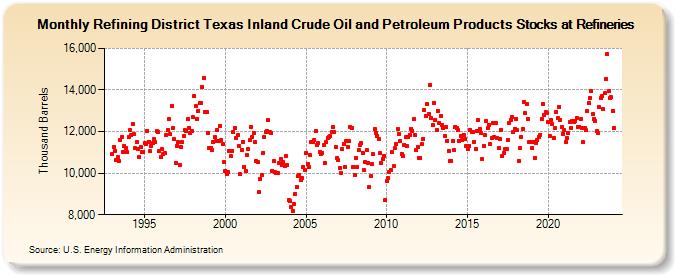
| Refining District Texas Inland Crude Oil and Petroleum Products Stocks at Refineries (Thousand Barrels) | ||||||||
| Year | Jan | Feb | Mar | Apr | May | Jun | Jul | Aug | Sep | Oct | Nov | Dec |
|---|---|---|---|---|---|---|---|---|---|---|---|---|
| 1993 | 10,928 | 11,264 | 11,067 | 10,608 | 10,768 | 10,582 | 11,608 | 11,734 | 11,029 | 11,294 | 11,231 | 11,015 |
| 1994 | 11,750 | 12,052 | 11,855 | 12,387 | 11,865 | 11,192 | 11,487 | 11,154 | 10,763 | 11,234 | 10,998 | 11,005 |
| 1995 | 11,467 | 11,381 | 12,049 | 11,516 | 11,051 | 11,317 | 11,429 | 11,651 | 11,474 | 12,011 | 12,000 | 11,073 |
| 1996 | 10,759 | 11,158 | 10,909 | 10,951 | 11,840 | 12,052 | 12,600 | 11,870 | 13,234 | 12,190 | 11,626 | 10,484 |
| 1997 | 11,314 | 11,492 | 10,385 | 11,257 | 11,478 | 11,785 | 12,056 | 12,028 | 12,584 | 12,186 | 11,935 | 12,049 |
| 1998 | 12,679 | 13,700 | 13,208 | 12,581 | 13,002 | 13,362 | 13,392 | 14,146 | 14,595 | 12,932 | 12,955 | 11,928 |
| 1999 | 11,200 | 11,219 | 11,089 | 11,484 | 11,737 | 11,555 | 12,083 | 11,543 | 12,259 | 11,601 | 11,408 | 10,553 |
| 2000 | 10,098 | 9,978 | 10,045 | 11,041 | 10,829 | 11,086 | 11,986 | 12,179 | 11,706 | 11,811 | 11,328 | 9,946 |
| 2001 | 11,103 | 11,503 | 10,318 | 10,125 | 10,884 | 11,159 | 11,571 | 12,239 | 11,738 | 11,944 | 11,474 | 10,580 |
| 2002 | 10,513 | 9,070 | 9,732 | 9,895 | 10,986 | 11,735 | 11,991 | 12,026 | 12,551 | 11,958 | 11,916 | 10,109 |
| 2003 | 10,580 | 10,041 | 10,024 | 9,985 | 10,467 | 10,700 | 10,410 | 10,524 | 10,366 | 10,829 | 10,378 | 8,705 |
| 2004 | 8,674 | 8,354 | 8,186 | 8,523 | 9,012 | 9,338 | 9,847 | 9,902 | 9,664 | 9,774 | 10,313 | 10,162 |
| 2005 | 10,975 | 10,451 | 10,272 | 10,860 | 11,496 | 11,486 | 11,616 | 12,034 | 11,346 | 11,433 | 11,030 | 10,928 |
| 2006 | 10,989 | 11,338 | 10,493 | 11,474 | 11,672 | 11,760 | 11,783 | 11,985 | 12,211 | 11,994 | 11,274 | 10,713 |
| 2007 | 10,614 | 10,265 | 10,009 | 11,140 | 11,381 | 10,313 | 11,562 | 11,248 | 11,529 | 12,213 | 12,188 | 10,318 |
| 2008 | 9,916 | 10,734 | 10,291 | 11,094 | 11,338 | 11,449 | 10,991 | 10,138 | 10,536 | 11,092 | 10,502 | 9,340 |
| 2009 | 9,842 | 10,433 | 10,897 | 12,131 | 11,949 | 11,778 | 11,620 | 10,951 | 10,467 | 10,665 | 10,809 | 8,689 |
| 2010 | 9,632 | 9,751 | 10,034 | 10,139 | 11,008 | 10,321 | 11,187 | 11,406 | 12,119 | 11,893 | 11,546 | 10,940 |
| 2011 | 10,807 | 11,365 | 11,726 | 11,294 | 11,762 | 11,849 | 12,129 | 12,040 | 12,596 | 11,846 | 11,127 | 11,251 |
| 2012 | 10,716 | 10,722 | 11,378 | 11,642 | 13,040 | 12,757 | 13,303 | 12,854 | 14,238 | 12,633 | 12,312 | 13,390 |
| 2013 | 12,573 | 12,067 | 12,990 | 12,409 | 12,742 | 12,309 | 12,150 | 11,795 | 12,231 | 11,559 | 11,086 | 10,580 |
| 2014 | 10,585 | 11,535 | 11,089 | 12,234 | 12,166 | 12,059 | 11,562 | 11,802 | 11,575 | 11,858 | 11,618 | 11,297 |
| 2015 | 11,171 | 11,311 | 12,088 | 11,992 | 11,971 | 11,503 | 11,150 | 12,021 | 12,555 | 12,139 | 11,907 | 10,657 |
| 2016 | 11,324 | 11,842 | 12,490 | 12,177 | 12,326 | 11,399 | 11,695 | 12,417 | 11,739 | 12,388 | 11,700 | 11,205 |
| 2017 | 11,642 | 12,083 | 10,815 | 10,977 | 11,166 | 11,138 | 11,596 | 12,419 | 12,568 | 12,705 | 11,980 | 12,143 |
| 2018 | 12,624 | 12,055 | 10,592 | 11,201 | 11,753 | 12,141 | 13,398 | 12,898 | 13,334 | 12,604 | 11,494 | 11,512 |
| 2019 | 11,202 | 11,513 | 10,751 | 11,442 | 11,573 | 11,744 | 11,856 | 12,592 | 13,343 | 12,813 | 12,931 | 12,889 |
| 2020 | 12,452 | 11,800 | 12,567 | 12,386 | 11,702 | 12,163 | 12,937 | 12,634 | 13,193 | 12,576 | 12,219 | 11,896 |
| 2021 | 12,051 | 11,510 | 11,684 | 11,910 | 12,464 | 12,193 | 12,493 | 12,476 | 12,504 | 12,664 | 12,220 | 12,243 |
| 2022 | 12,581 | 12,164 | 11,481 | 12,147 | 12,053 | 12,998 | 13,369 | 13,623 | 13,932 | 12,823 | 12,609 | 12,509 |
| 2023 | 12,013 | 11,941 | 13,172 | 13,591 | 13,725 | 13,078 | 13,841 | 14,548 | 15,727 | 13,951 | 13,614 | 13,647 |
| 2024 | 12,992 | |||||||||||
| - = No Data Reported; -- = Not Applicable; NA = Not Available; W = Withheld to avoid disclosure of individual company data. |
| Release Date: 3/29/2024 |
| Next Release Date: 4/30/2024 |