|
Download Data (XLS File) |
|
||||||||
|
||||||||
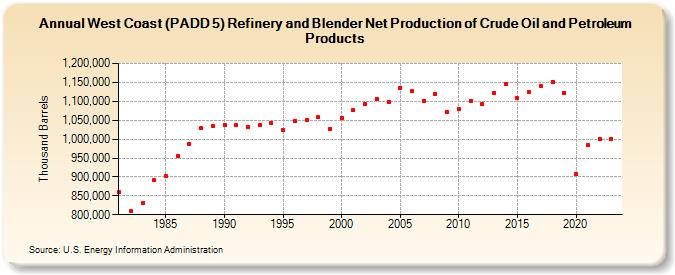
| West Coast (PADD 5) Refinery and Blender Net Production of Crude Oil and Petroleum Products (Thousand Barrels) | ||||||||
| Decade | Year-0 | Year-1 | Year-2 | Year-3 | Year-4 | Year-5 | Year-6 | Year-7 | Year-8 | Year-9 |
|---|---|---|---|---|---|---|---|---|---|---|
| 1980's | 859,016 | 808,586 | 830,478 | 891,383 | 902,235 | 955,709 | 987,122 | 1,028,502 | 1,034,804 | |
| 1990's | 1,038,340 | 1,037,389 | 1,032,343 | 1,038,493 | 1,042,648 | 1,023,881 | 1,048,731 | 1,050,809 | 1,057,561 | 1,026,834 |
| 2000's | 1,057,007 | 1,076,646 | 1,093,873 | 1,106,733 | 1,098,954 | 1,136,081 | 1,126,863 | 1,101,876 | 1,120,166 | 1,071,012 |
| 2010's | 1,079,962 | 1,101,821 | 1,093,588 | 1,123,150 | 1,145,283 | 1,107,582 | 1,124,649 | 1,139,244 | 1,152,057 | 1,122,935 |
| 2020's | 907,903 | 983,767 | 1,000,921 | 1,000,923 |
| - = No Data Reported; -- = Not Applicable; NA = Not Available; W = Withheld to avoid disclosure of individual company data. |
| Release Date: 3/29/2024 |
| Next Release Date: 8/30/2024 |