|
Download Data (XLS File) |
|
||||||||
|
||||||||
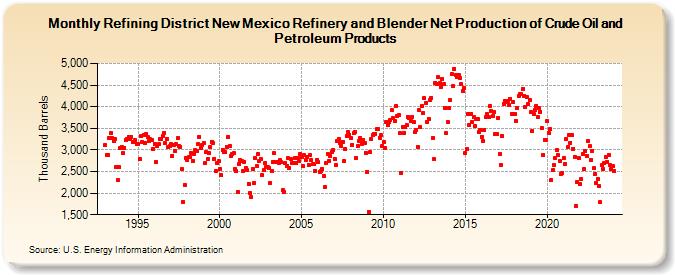
| Refining District New Mexico Refinery and Blender Net Production of Crude Oil and Petroleum Products (Thousand Barrels) | ||||||||
| Year | Jan | Feb | Mar | Apr | May | Jun | Jul | Aug | Sep | Oct | Nov | Dec |
|---|---|---|---|---|---|---|---|---|---|---|---|---|
| 1993 | 3,106 | 2,885 | 2,889 | 3,283 | 3,391 | 3,267 | 3,195 | 3,251 | 2,600 | 2,295 | 2,599 | 3,053 |
| 1994 | 3,068 | 2,927 | 3,051 | 3,239 | 3,245 | 3,307 | 3,254 | 3,308 | 3,186 | 3,191 | 3,218 | 3,142 |
| 1995 | 3,137 | 2,789 | 3,321 | 3,183 | 3,350 | 3,170 | 3,376 | 3,289 | 3,206 | 3,241 | 3,227 | 3,032 |
| 1996 | 3,145 | 2,727 | 3,093 | 3,125 | 3,242 | 3,244 | 3,328 | 3,402 | 3,149 | 3,258 | 3,057 | 3,085 |
| 1997 | 3,125 | 2,870 | 3,110 | 2,978 | 3,134 | 3,271 | 3,094 | 3,061 | 2,555 | 1,797 | 2,188 | 2,801 |
| 1998 | 2,762 | 2,841 | 2,843 | 2,928 | 2,751 | 2,906 | 2,997 | 2,965 | 3,127 | 3,309 | 3,049 | 3,122 |
| 1999 | 3,159 | 2,690 | 2,943 | 2,790 | 2,924 | 3,061 | 3,191 | 3,163 | 2,797 | 2,516 | 2,696 | 2,742 |
| 2000 | 2,561 | 2,419 | 3,003 | 2,951 | 2,940 | 3,077 | 3,307 | 3,090 | 2,866 | 2,902 | 2,917 | 2,558 |
| 2001 | 2,501 | 2,036 | 2,677 | 2,767 | 2,734 | 2,508 | 2,719 | 2,583 | 2,525 | 2,219 | 1,997 | 1,908 |
| 2002 | 2,564 | 2,236 | 2,803 | 2,627 | 2,908 | 2,752 | 2,789 | 2,418 | 2,529 | 2,687 | 2,606 | 2,598 |
| 2003 | 2,576 | 2,232 | 2,519 | 2,726 | 2,918 | 2,721 | 2,723 | 2,693 | 2,765 | 2,728 | 2,068 | 2,027 |
| 2004 | 2,698 | 2,635 | 2,804 | 2,586 | 2,780 | 2,698 | 2,708 | 2,805 | 2,700 | 2,812 | 2,733 | 2,904 |
| 2005 | 2,841 | 2,620 | 2,875 | 2,767 | 2,833 | 2,655 | 2,872 | 2,755 | 2,666 | 2,666 | 2,518 | 2,774 |
| 2006 | 2,719 | 2,485 | 2,512 | 2,565 | 2,407 | 2,143 | 2,701 | 2,906 | 2,754 | 2,860 | 2,958 | 3,000 |
| 2007 | 2,796 | 2,651 | 3,198 | 3,244 | 3,163 | 3,099 | 3,188 | 2,748 | 3,032 | 3,316 | 3,422 | 3,353 |
| 2008 | 3,280 | 3,119 | 3,380 | 3,424 | 2,823 | 3,085 | 3,207 | 3,276 | 3,140 | 3,239 | 3,155 | 2,937 |
| 2009 | 2,495 | 1,573 | 2,942 | 3,243 | 3,346 | 3,375 | 3,377 | 3,483 | 3,488 | 3,282 | 3,339 | 3,092 |
| 2010 | 3,186 | 3,043 | 3,641 | 3,566 | 3,636 | 3,703 | 3,926 | 3,731 | 3,658 | 4,007 | 3,789 | 3,798 |
| 2011 | 3,383 | 2,473 | 3,533 | 3,394 | 3,521 | 3,570 | 3,764 | 3,745 | 3,665 | 3,769 | 3,643 | 3,413 |
| 2012 | 3,469 | 3,073 | 3,914 | 3,521 | 4,017 | 3,861 | 4,194 | 4,093 | 3,644 | 3,721 | 4,153 | 4,202 |
| 2013 | 3,277 | 2,778 | 4,558 | 4,526 | 4,678 | 4,547 | 4,449 | 4,651 | 4,518 | 3,978 | 3,384 | 3,648 |
| 2014 | 3,962 | 4,144 | 4,761 | 4,476 | 4,877 | 4,723 | 4,677 | 4,735 | 4,654 | 4,514 | 4,363 | 4,428 |
| 2015 | 2,927 | 3,011 | 3,835 | 3,572 | 3,831 | 3,645 | 3,755 | 3,546 | 3,711 | 3,710 | 3,411 | 3,465 |
| 2016 | 3,306 | 3,216 | 3,466 | 3,757 | 3,831 | 3,753 | 4,006 | 3,898 | 3,789 | 3,873 | 3,373 | 3,377 |
| 2017 | 3,749 | 2,901 | 2,655 | 3,321 | 4,069 | 4,139 | 4,103 | 4,121 | 4,038 | 4,180 | 3,840 | 4,098 |
| 2018 | 3,834 | 3,675 | 3,976 | 4,251 | 4,304 | 4,283 | 4,415 | 4,258 | 3,994 | 4,222 | 4,061 | 4,151 |
| 2019 | 3,877 | 3,438 | 3,836 | 3,932 | 4,020 | 3,759 | 3,963 | 3,888 | 3,509 | 2,888 | 3,240 | 3,240 |
| 2020 | 3,667 | 3,400 | 3,479 | 2,294 | 2,530 | 2,644 | 2,819 | 3,002 | 2,876 | 2,747 | 2,447 | 2,465 |
| 2021 | 2,817 | 2,671 | 3,257 | 3,059 | 3,348 | 3,171 | 3,339 | 3,027 | 2,840 | 1,706 | 2,257 | 2,802 |
| 2022 | 2,212 | 2,324 | 2,905 | 2,554 | 2,972 | 2,866 | 3,207 | 3,084 | 2,771 | 2,982 | 2,575 | 2,440 |
| 2023 | 2,242 | 2,324 | 2,159 | 1,788 | 2,641 | 2,548 | 2,701 | 2,847 | 2,730 | 2,881 | 2,644 | 2,548 |
| 2024 | 2,617 | |||||||||||
| - = No Data Reported; -- = Not Applicable; NA = Not Available; W = Withheld to avoid disclosure of individual company data. |
| Release Date: 3/29/2024 |
| Next Release Date: 4/30/2024 |