|
Download Data (XLS File) |
|
||||||||
|
||||||||
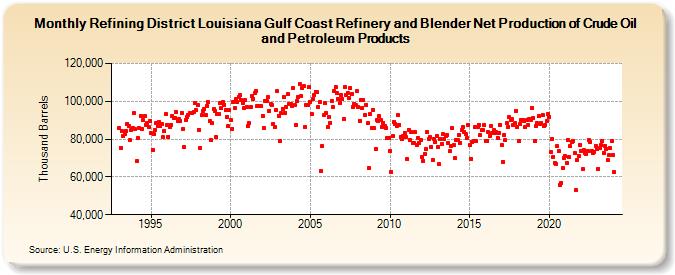
| Refining District Louisiana Gulf Coast Refinery and Blender Net Production of Crude Oil and Petroleum Products (Thousand Barrels) | ||||||||
| Year | Jan | Feb | Mar | Apr | May | Jun | Jul | Aug | Sep | Oct | Nov | Dec |
|---|---|---|---|---|---|---|---|---|---|---|---|---|
| 1993 | 85,799 | 75,415 | 84,134 | 81,836 | 82,917 | 84,147 | 88,195 | 86,941 | 79,384 | 84,916 | 85,989 | 93,599 |
| 1994 | 85,139 | 68,360 | 80,351 | 85,916 | 91,979 | 85,547 | 90,037 | 92,139 | 87,698 | 88,357 | 86,155 | 89,799 |
| 1995 | 83,100 | 74,354 | 82,746 | 84,835 | 88,645 | 86,982 | 89,100 | 86,701 | 87,977 | 80,871 | 84,146 | 93,126 |
| 1996 | 87,515 | 81,363 | 86,661 | 87,637 | 92,277 | 91,385 | 91,191 | 94,235 | 89,391 | 90,436 | 89,619 | 93,828 |
| 1997 | 85,372 | 75,618 | 89,970 | 91,791 | 92,971 | 93,583 | 93,793 | 93,901 | 94,571 | 99,064 | 95,177 | 97,800 |
| 1998 | 84,960 | 75,412 | 92,611 | 94,704 | 95,764 | 92,899 | 97,760 | 99,389 | 89,549 | 79,300 | 88,325 | 95,808 |
| 1999 | 94,844 | 81,033 | 93,268 | 93,108 | 99,030 | 96,317 | 99,384 | 98,244 | 95,275 | 91,745 | 86,758 | 95,204 |
| 2000 | 90,049 | 85,563 | 99,841 | 96,199 | 100,947 | 99,367 | 102,474 | 103,240 | 100,652 | 99,105 | 96,362 | 100,590 |
| 2001 | 97,146 | 87,083 | 88,254 | 96,839 | 102,693 | 101,215 | 104,246 | 105,558 | 97,406 | 97,772 | 97,261 | 97,335 |
| 2002 | 92,407 | 86,045 | 100,398 | 100,000 | 102,109 | 95,007 | 98,410 | 98,109 | 87,975 | 86,341 | 95,487 | 105,226 |
| 2003 | 92,476 | 78,807 | 93,664 | 96,069 | 102,392 | 94,010 | 97,230 | 103,829 | 98,827 | 98,734 | 97,669 | 106,795 |
| 2004 | 97,966 | 87,612 | 100,085 | 102,286 | 109,273 | 102,598 | 107,110 | 107,938 | 86,405 | 97,908 | 97,890 | 107,397 |
| 2005 | 99,809 | 93,173 | 101,324 | 103,426 | 105,129 | 104,755 | 97,080 | 99,643 | 63,108 | 76,337 | 92,500 | 98,945 |
| 2006 | 93,791 | 86,164 | 91,628 | 88,670 | 100,415 | 97,179 | 105,496 | 107,582 | 104,121 | 101,104 | 98,926 | 103,272 |
| 2007 | 101,117 | 90,505 | 107,809 | 103,064 | 104,406 | 101,945 | 106,848 | 103,834 | 96,882 | 98,821 | 98,079 | 105,380 |
| 2008 | 96,890 | 89,781 | 100,435 | 96,694 | 100,516 | 92,862 | 98,233 | 88,340 | 64,723 | 93,146 | 86,022 | 95,553 |
| 2009 | 85,642 | 74,834 | 90,182 | 89,686 | 92,142 | 90,017 | 86,263 | 88,559 | 87,059 | 86,049 | 80,528 | 80,746 |
| 2010 | 73,795 | 62,464 | 81,512 | 89,190 | 88,238 | 86,980 | 92,638 | 87,625 | 81,359 | 79,969 | 81,649 | 83,481 |
| 2011 | 80,918 | 69,417 | 84,875 | 79,777 | 83,971 | 78,081 | 78,111 | 83,499 | 77,108 | 80,617 | 78,070 | 79,779 |
| 2012 | 70,488 | 68,608 | 72,213 | 74,510 | 83,871 | 80,116 | 81,227 | 76,043 | 68,885 | 80,272 | 78,400 | 81,832 |
| 2013 | 75,854 | 66,570 | 80,033 | 77,620 | 82,473 | 79,860 | 81,752 | 82,335 | 78,082 | 73,441 | 76,218 | 85,770 |
| 2014 | 76,874 | 69,956 | 79,505 | 79,516 | 82,201 | 78,127 | 84,696 | 86,388 | 83,818 | 82,507 | 80,706 | 87,678 |
| 2015 | 76,661 | 69,645 | 78,634 | 78,954 | 86,210 | 78,789 | 86,302 | 87,674 | 81,967 | 84,843 | 84,572 | 87,436 |
| 2016 | 79,036 | 78,859 | 83,789 | 81,671 | 86,791 | 82,997 | 84,668 | 83,173 | 83,670 | 80,789 | 83,314 | 87,630 |
| 2017 | 76,960 | 68,114 | 82,288 | 79,611 | 88,308 | 86,417 | 91,433 | 90,313 | 90,457 | 87,331 | 88,274 | 95,016 |
| 2018 | 86,243 | 78,781 | 87,939 | 89,961 | 90,179 | 89,315 | 86,595 | 90,229 | 87,525 | 90,683 | 90,149 | 96,366 |
| 2019 | 91,174 | 79,011 | 87,100 | 88,311 | 92,155 | 88,002 | 88,383 | 92,953 | 86,963 | 87,608 | 89,571 | 93,311 |
| 2020 | 91,922 | 73,077 | 80,174 | 70,697 | 67,392 | 66,867 | 76,159 | 73,541 | 55,872 | 56,858 | 64,837 | 70,257 |
| 2021 | 70,848 | 67,525 | 79,381 | 70,584 | 76,262 | 78,684 | 79,166 | 72,714 | 52,908 | 68,815 | 71,275 | 77,014 |
| 2022 | 73,938 | 64,030 | 74,146 | 72,896 | 71,875 | 73,745 | 79,460 | 78,665 | 73,770 | 72,856 | 73,245 | 76,606 |
| 2023 | 74,571 | 64,318 | 75,051 | 76,785 | 78,780 | 72,825 | 76,572 | 74,944 | 68,727 | 71,488 | 75,284 | 78,915 |
| 2024 | 71,637 | |||||||||||
| - = No Data Reported; -- = Not Applicable; NA = Not Available; W = Withheld to avoid disclosure of individual company data. |
| Release Date: 3/29/2024 |
| Next Release Date: 4/30/2024 |