|
Download Data (XLS File) |
|
||||||||
|
||||||||
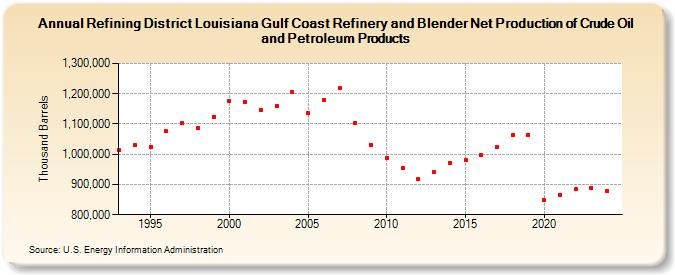
| Refining District Louisiana Gulf Coast Refinery and Blender Net Production of Crude Oil and Petroleum Products (Thousand Barrels) | ||||||||
| Decade | Year-0 | Year-1 | Year-2 | Year-3 | Year-4 | Year-5 | Year-6 | Year-7 | Year-8 | Year-9 |
|---|---|---|---|---|---|---|---|---|---|---|
| 1990's | 1,013,272 | 1,031,477 | 1,022,583 | 1,075,538 | 1,103,611 | 1,086,481 | 1,124,210 | |||
| 2000's | 1,174,389 | 1,172,808 | 1,147,514 | 1,160,502 | 1,204,468 | 1,135,229 | 1,178,348 | 1,218,690 | 1,103,195 | 1,031,707 |
| 2010's | 988,900 | 954,223 | 916,465 | 940,008 | 971,972 | 981,687 | 996,387 | 1,024,522 | 1,063,965 | 1,064,542 |
| 2020's | 847,653 | 865,176 | 885,232 | 888,260 |
| - = No Data Reported; -- = Not Applicable; NA = Not Available; W = Withheld to avoid disclosure of individual company data. |
| Release Date: 4/30/2024 |
| Next Release Date: 8/30/2024 |