|
Download Data (XLS File) |
|
||||||||
|
||||||||
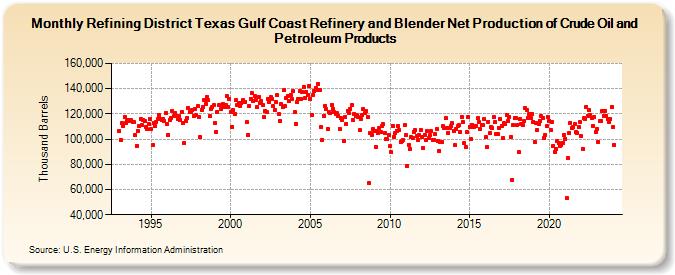
| Refining District Texas Gulf Coast Refinery and Blender Net Production of Crude Oil and Petroleum Products (Thousand Barrels) | ||||||||
| Year | Jan | Feb | Mar | Apr | May | Jun | Jul | Aug | Sep | Oct | Nov | Dec |
|---|---|---|---|---|---|---|---|---|---|---|---|---|
| 1993 | 106,366 | 99,433 | 112,449 | 110,657 | 117,664 | 112,569 | 115,278 | 114,723 | 114,947 | 114,936 | 113,845 | 113,240 |
| 1994 | 103,220 | 94,787 | 106,691 | 110,244 | 116,133 | 111,020 | 115,219 | 114,356 | 109,830 | 107,650 | 112,315 | 115,652 |
| 1995 | 107,941 | 95,583 | 112,617 | 110,122 | 113,623 | 115,569 | 118,995 | 116,181 | 115,452 | 116,161 | 114,343 | 120,971 |
| 1996 | 112,030 | 103,562 | 115,404 | 116,826 | 122,005 | 118,231 | 121,090 | 118,102 | 115,990 | 118,037 | 115,268 | 121,846 |
| 1997 | 112,460 | 96,854 | 114,736 | 116,959 | 124,640 | 121,840 | 121,686 | 123,133 | 118,149 | 124,011 | 119,361 | 126,089 |
| 1998 | 117,704 | 101,557 | 123,262 | 125,715 | 130,850 | 128,150 | 133,439 | 130,713 | 118,423 | 124,219 | 125,073 | 126,679 |
| 1999 | 112,808 | 105,704 | 121,598 | 126,819 | 127,127 | 123,487 | 128,057 | 125,087 | 127,037 | 133,877 | 125,358 | 131,989 |
| 2000 | 121,276 | 109,720 | 123,001 | 120,143 | 130,953 | 127,349 | 128,532 | 126,469 | 128,345 | 130,974 | 129,227 | 129,784 |
| 2001 | 113,283 | 103,400 | 126,570 | 132,213 | 136,347 | 130,395 | 133,862 | 131,420 | 125,386 | 133,421 | 128,444 | 130,407 |
| 2002 | 127,406 | 117,328 | 122,322 | 121,753 | 131,750 | 129,174 | 133,131 | 131,924 | 125,974 | 122,764 | 129,622 | 134,864 |
| 2003 | 119,717 | 114,484 | 127,515 | 125,402 | 138,628 | 125,898 | 132,647 | 134,585 | 130,241 | 135,120 | 132,047 | 137,845 |
| 2004 | 121,129 | 112,173 | 129,235 | 132,148 | 138,179 | 131,469 | 137,633 | 141,425 | 132,906 | 137,422 | 135,000 | 142,110 |
| 2005 | 132,212 | 119,122 | 135,329 | 138,118 | 140,618 | 138,588 | 144,042 | 138,799 | 109,801 | 99,550 | 118,347 | 126,259 |
| 2006 | 123,560 | 108,367 | 121,340 | 120,465 | 127,422 | 124,170 | 121,654 | 120,204 | 120,391 | 118,348 | 108,209 | 116,360 |
| 2007 | 115,514 | 98,394 | 117,866 | 112,224 | 122,463 | 120,940 | 124,138 | 126,768 | 115,549 | 120,199 | 118,227 | 119,113 |
| 2008 | 117,353 | 107,035 | 116,301 | 118,826 | 124,062 | 120,476 | 121,954 | 117,929 | 65,053 | 104,528 | 103,395 | 107,655 |
| 2009 | 106,363 | 93,828 | 106,202 | 104,938 | 109,051 | 105,622 | 110,475 | 111,665 | 104,970 | 99,848 | 99,688 | 103,017 |
| 2010 | 94,404 | 89,502 | 110,739 | 101,881 | 104,584 | 106,633 | 110,714 | 107,170 | 97,915 | 98,254 | 99,344 | 110,929 |
| 2011 | 103,370 | 78,718 | 95,697 | 92,136 | 101,698 | 101,166 | 105,626 | 106,886 | 102,253 | 99,662 | 103,072 | 107,015 |
| 2012 | 101,931 | 92,739 | 103,054 | 99,264 | 106,077 | 100,859 | 102,987 | 106,070 | 99,487 | 99,474 | 104,008 | 108,110 |
| 2013 | 98,140 | 90,592 | 97,507 | 97,434 | 110,147 | 108,994 | 116,647 | 108,581 | 104,990 | 108,859 | 110,266 | 112,438 |
| 2014 | 106,635 | 95,103 | 108,026 | 110,030 | 110,926 | 105,286 | 117,909 | 113,498 | 97,288 | 93,741 | 105,520 | 117,665 |
| 2015 | 109,977 | 99,719 | 111,384 | 109,756 | 110,461 | 110,116 | 116,445 | 113,607 | 107,939 | 110,942 | 111,280 | 115,961 |
| 2016 | 101,448 | 93,717 | 113,870 | 104,552 | 109,907 | 109,180 | 117,551 | 113,426 | 104,356 | 103,823 | 108,925 | 116,085 |
| 2017 | 110,640 | 100,550 | 112,446 | 111,832 | 119,124 | 114,691 | 117,917 | 101,889 | 67,852 | 111,291 | 116,656 | 116,700 |
| 2018 | 111,544 | 89,437 | 115,716 | 112,265 | 111,339 | 114,146 | 124,476 | 123,192 | 117,096 | 119,551 | 116,697 | 120,167 |
| 2019 | 113,777 | 97,658 | 112,628 | 107,328 | 112,107 | 114,637 | 118,114 | 117,005 | 101,259 | 103,223 | 110,510 | 117,629 |
| 2020 | 114,393 | 107,134 | 113,593 | 94,776 | 89,953 | 92,343 | 98,360 | 96,515 | 94,527 | 95,263 | 97,201 | 103,486 |
| 2021 | 100,134 | 53,064 | 84,928 | 105,180 | 113,076 | 108,725 | 109,229 | 111,586 | 105,448 | 105,019 | 109,314 | 113,381 |
| 2022 | 102,230 | 92,285 | 116,459 | 116,169 | 125,663 | 118,593 | 123,047 | 119,395 | 116,525 | 110,600 | 117,343 | 105,793 |
| 2023 | 108,394 | 98,037 | 114,185 | 114,596 | 122,528 | 118,565 | 122,690 | 118,484 | 116,144 | 113,689 | 115,767 | 125,551 |
| 2024 | 109,262 | |||||||||||
| - = No Data Reported; -- = Not Applicable; NA = Not Available; W = Withheld to avoid disclosure of individual company data. |
| Release Date: 3/29/2024 |
| Next Release Date: 4/30/2024 |