|
Download Data (XLS File) |
|
||||||||
|
||||||||
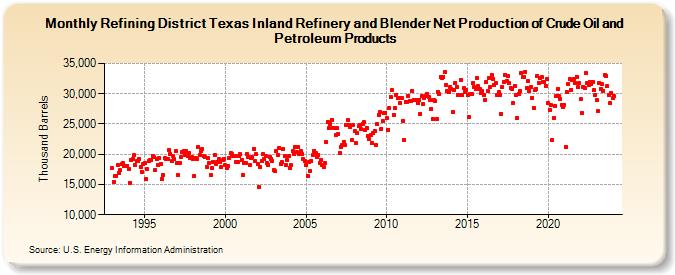
| Refining District Texas Inland Refinery and Blender Net Production of Crude Oil and Petroleum Products (Thousand Barrels) | ||||||||
| Year | Jan | Feb | Mar | Apr | May | Jun | Jul | Aug | Sep | Oct | Nov | Dec |
|---|---|---|---|---|---|---|---|---|---|---|---|---|
| 1993 | 17,671 | 15,471 | 16,395 | 16,437 | 18,214 | 16,921 | 17,350 | 18,338 | 18,468 | 18,077 | 18,124 | 18,130 |
| 1994 | 17,532 | 15,295 | 18,986 | 19,201 | 19,818 | 18,209 | 18,857 | 18,924 | 19,187 | 17,968 | 17,118 | 18,396 |
| 1995 | 18,631 | 15,857 | 17,498 | 18,799 | 19,013 | 19,068 | 19,750 | 19,591 | 17,421 | 19,239 | 18,298 | 19,329 |
| 1996 | 18,368 | 15,883 | 16,568 | 19,329 | 19,220 | 19,266 | 20,620 | 20,071 | 18,867 | 19,652 | 19,163 | 20,474 |
| 1997 | 18,577 | 16,526 | 18,492 | 19,518 | 20,336 | 20,485 | 19,920 | 20,570 | 19,678 | 20,179 | 19,325 | 19,468 |
| 1998 | 19,132 | 16,448 | 19,448 | 19,132 | 21,187 | 19,811 | 20,612 | 20,824 | 19,625 | 19,511 | 17,926 | 19,318 |
| 1999 | 18,546 | 16,527 | 17,726 | 18,759 | 19,901 | 18,325 | 18,712 | 19,184 | 18,784 | 17,808 | 19,028 | 19,284 |
| 2000 | 18,164 | 17,642 | 18,000 | 19,444 | 20,133 | 20,040 | 19,637 | 19,784 | 18,791 | 18,651 | 19,645 | 19,965 |
| 2001 | 19,092 | 16,519 | 18,611 | 18,480 | 20,024 | 19,548 | 18,140 | 19,453 | 19,525 | 20,945 | 18,878 | 20,008 |
| 2002 | 18,329 | 14,581 | 17,927 | 18,886 | 20,006 | 19,257 | 19,671 | 18,598 | 18,257 | 19,516 | 19,274 | 18,905 |
| 2003 | 17,383 | 17,166 | 20,597 | 19,920 | 20,969 | 18,414 | 18,639 | 20,841 | 19,657 | 18,223 | 19,055 | 19,680 |
| 2004 | 17,800 | 18,169 | 20,466 | 20,061 | 21,173 | 20,348 | 21,112 | 20,039 | 20,450 | 20,066 | 19,205 | 18,805 |
| 2005 | 18,256 | 16,475 | 18,676 | 17,288 | 18,880 | 19,838 | 20,602 | 20,242 | 19,546 | 19,885 | 18,569 | 19,026 |
| 2006 | 18,161 | 17,864 | 18,610 | 22,028 | 25,325 | 24,308 | 25,023 | 25,726 | 24,346 | 24,261 | 23,145 | 24,260 |
| 2007 | 23,403 | 20,231 | 21,178 | 21,494 | 22,034 | 21,545 | 24,846 | 25,618 | 24,894 | 24,432 | 22,406 | 24,889 |
| 2008 | 23,774 | 21,788 | 23,582 | 24,591 | 24,884 | 24,107 | 25,036 | 25,273 | 24,025 | 24,404 | 22,962 | 22,472 |
| 2009 | 23,181 | 21,846 | 23,557 | 23,861 | 21,561 | 24,926 | 26,538 | 26,902 | 24,214 | 25,416 | 26,786 | 26,834 |
| 2010 | 25,996 | 24,046 | 27,678 | 29,445 | 30,561 | 26,559 | 27,649 | 29,818 | 29,306 | 29,370 | 28,544 | 29,287 |
| 2011 | 25,555 | 22,340 | 28,675 | 28,684 | 29,652 | 28,817 | 28,799 | 30,491 | 28,976 | 28,929 | 28,934 | 28,397 |
| 2012 | 29,026 | 26,692 | 29,566 | 28,304 | 29,346 | 29,706 | 30,004 | 29,434 | 28,999 | 27,543 | 25,861 | 28,917 |
| 2013 | 28,785 | 25,806 | 30,337 | 29,981 | 32,844 | 32,573 | 32,847 | 33,574 | 31,476 | 30,419 | 30,226 | 31,178 |
| 2014 | 30,806 | 26,941 | 30,570 | 31,765 | 31,136 | 29,759 | 29,829 | 32,326 | 29,819 | 30,933 | 30,317 | 30,683 |
| 2015 | 29,849 | 26,142 | 29,955 | 29,913 | 31,739 | 31,089 | 30,781 | 32,555 | 31,202 | 30,733 | 30,124 | 30,391 |
| 2016 | 29,760 | 29,021 | 32,004 | 30,415 | 32,604 | 31,157 | 33,129 | 32,496 | 31,519 | 31,735 | 29,778 | 30,263 |
| 2017 | 29,822 | 26,690 | 31,127 | 31,931 | 33,115 | 32,174 | 32,994 | 31,744 | 30,980 | 30,707 | 28,427 | 31,330 |
| 2018 | 29,743 | 26,064 | 29,923 | 30,486 | 33,438 | 32,723 | 32,727 | 33,661 | 30,949 | 32,087 | 30,533 | 31,178 |
| 2019 | 29,261 | 27,693 | 30,569 | 30,831 | 32,963 | 31,798 | 32,655 | 32,717 | 31,991 | 31,916 | 31,345 | 32,369 |
| 2020 | 28,458 | 27,317 | 28,071 | 22,332 | 26,066 | 28,027 | 29,641 | 30,842 | 29,546 | 29,196 | 28,214 | 27,852 |
| 2021 | 28,154 | 21,240 | 30,238 | 31,649 | 32,386 | 30,671 | 32,233 | 32,460 | 31,793 | 32,835 | 31,087 | 31,741 |
| 2022 | 29,063 | 26,799 | 31,170 | 30,909 | 33,455 | 31,839 | 31,451 | 31,971 | 31,664 | 31,896 | 30,597 | 29,866 |
| 2023 | 28,917 | 27,084 | 31,822 | 30,857 | 31,549 | 30,464 | 33,052 | 32,987 | 31,277 | 29,795 | 28,456 | 30,096 |
| 2024 | 29,265 | |||||||||||
| - = No Data Reported; -- = Not Applicable; NA = Not Available; W = Withheld to avoid disclosure of individual company data. |
| Release Date: 3/29/2024 |
| Next Release Date: 4/30/2024 |