|
Download Data (XLS File) |
|
||||||||
|
||||||||
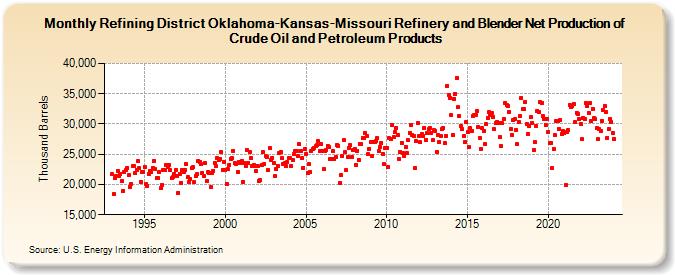
| Refining District Oklahoma-Kansas-Missouri Refinery and Blender Net Production of Crude Oil and Petroleum Products (Thousand Barrels) | ||||||||
| Year | Jan | Feb | Mar | Apr | May | Jun | Jul | Aug | Sep | Oct | Nov | Dec |
|---|---|---|---|---|---|---|---|---|---|---|---|---|
| 1993 | 21,725 | 18,432 | 21,049 | 21,380 | 22,258 | 21,336 | 21,809 | 20,560 | 18,964 | 21,998 | 22,368 | 22,737 |
| 1994 | 21,503 | 19,561 | 20,146 | 22,991 | 23,097 | 21,894 | 22,426 | 23,798 | 22,643 | 20,373 | 22,092 | 22,136 |
| 1995 | 22,927 | 20,075 | 19,759 | 21,756 | 22,277 | 22,041 | 22,756 | 23,899 | 22,489 | 21,026 | 21,057 | 21,979 |
| 1996 | 19,344 | 19,962 | 22,433 | 22,311 | 23,145 | 22,897 | 23,162 | 22,386 | 20,993 | 21,188 | 21,774 | 22,390 |
| 1997 | 21,361 | 18,622 | 21,777 | 20,284 | 22,394 | 22,099 | 22,467 | 23,328 | 21,205 | 20,442 | 20,917 | 22,718 |
| 1998 | 22,830 | 20,380 | 21,382 | 21,691 | 23,893 | 23,741 | 23,312 | 21,906 | 21,372 | 23,510 | 20,529 | 22,070 |
| 1999 | 21,879 | 19,528 | 21,903 | 22,268 | 23,592 | 23,083 | 24,381 | 24,026 | 24,243 | 25,342 | 22,377 | 23,763 |
| 2000 | 22,416 | 20,137 | 22,543 | 23,243 | 24,266 | 24,310 | 25,576 | 23,469 | 23,438 | 22,112 | 23,763 | 23,516 |
| 2001 | 23,905 | 20,413 | 23,510 | 23,027 | 25,718 | 23,606 | 25,303 | 24,384 | 23,014 | 23,293 | 23,107 | 22,146 |
| 2002 | 23,091 | 20,567 | 20,677 | 23,141 | 25,387 | 23,394 | 24,649 | 24,506 | 22,347 | 26,057 | 24,117 | 24,442 |
| 2003 | 23,522 | 21,334 | 22,505 | 23,101 | 25,146 | 25,356 | 24,309 | 23,423 | 23,627 | 22,982 | 23,739 | 24,360 |
| 2004 | 24,297 | 23,011 | 24,052 | 24,967 | 25,508 | 25,526 | 24,726 | 26,624 | 25,571 | 24,299 | 22,782 | 25,879 |
| 2005 | 25,018 | 21,858 | 23,399 | 22,080 | 25,593 | 25,885 | 25,994 | 26,304 | 26,464 | 27,149 | 25,464 | 26,633 |
| 2006 | 25,526 | 22,597 | 25,461 | 25,776 | 26,403 | 26,216 | 24,177 | 24,282 | 25,472 | 24,269 | 24,613 | 26,589 |
| 2007 | 26,359 | 20,248 | 21,499 | 24,725 | 27,292 | 25,305 | 22,335 | 24,576 | 25,999 | 26,482 | 24,569 | 25,658 |
| 2008 | 25,784 | 23,250 | 25,555 | 24,006 | 26,711 | 26,716 | 27,608 | 27,622 | 28,549 | 28,093 | 25,026 | 25,907 |
| 2009 | 27,039 | 24,778 | 27,028 | 27,027 | 27,257 | 27,640 | 25,491 | 26,271 | 26,864 | 25,073 | 23,312 | 25,993 |
| 2010 | 26,095 | 22,966 | 27,651 | 27,516 | 29,781 | 27,834 | 28,684 | 29,331 | 28,140 | 24,268 | 25,356 | 26,870 |
| 2011 | 25,146 | 24,747 | 26,226 | 25,196 | 27,283 | 28,573 | 29,872 | 28,114 | 28,031 | 22,755 | 27,110 | 30,176 |
| 2012 | 28,008 | 26,975 | 28,307 | 28,087 | 29,328 | 27,396 | 28,493 | 29,124 | 29,361 | 28,495 | 27,277 | 28,937 |
| 2013 | 28,920 | 25,440 | 28,122 | 26,979 | 28,029 | 29,119 | 29,410 | 26,776 | 28,029 | 36,305 | 34,803 | 34,369 |
| 2014 | 31,446 | 28,168 | 34,180 | 34,976 | 37,629 | 32,729 | 31,339 | 29,653 | 29,139 | 27,984 | 26,978 | 30,299 |
| 2015 | 28,630 | 26,136 | 29,259 | 28,904 | 31,256 | 31,434 | 31,456 | 32,090 | 29,488 | 27,708 | 25,791 | 29,281 |
| 2016 | 28,868 | 26,674 | 29,938 | 31,018 | 31,936 | 31,522 | 31,760 | 31,156 | 29,139 | 30,186 | 30,327 | 30,187 |
| 2017 | 27,835 | 26,298 | 30,114 | 30,743 | 33,527 | 33,158 | 33,034 | 32,003 | 29,154 | 28,238 | 30,706 | 30,783 |
| 2018 | 29,067 | 26,636 | 30,353 | 31,302 | 34,264 | 32,467 | 32,449 | 33,618 | 29,997 | 28,347 | 29,599 | 31,180 |
| 2019 | 30,196 | 25,676 | 27,004 | 29,682 | 32,173 | 31,917 | 33,557 | 33,412 | 31,293 | 30,767 | 29,759 | 30,852 |
| 2020 | 28,593 | 26,799 | 26,909 | 22,642 | 25,884 | 28,172 | 30,475 | 30,414 | 29,179 | 30,601 | 28,381 | 28,775 |
| 2021 | 28,429 | 19,941 | 28,742 | 28,981 | 33,163 | 32,777 | 32,893 | 33,340 | 30,276 | 31,896 | 31,602 | 30,818 |
| 2022 | 30,037 | 27,439 | 31,024 | 30,770 | 33,450 | 32,961 | 31,843 | 33,530 | 30,455 | 32,503 | 30,970 | 30,805 |
| 2023 | 29,261 | 27,442 | 29,094 | 28,883 | 30,549 | 32,298 | 32,938 | 31,945 | 27,742 | 29,240 | 30,843 | 30,316 |
| 2024 | 28,510 | |||||||||||
| - = No Data Reported; -- = Not Applicable; NA = Not Available; W = Withheld to avoid disclosure of individual company data. |
| Release Date: 3/29/2024 |
| Next Release Date: 4/30/2024 |