|
Download Data (XLS File) |
|
||||||||
|
||||||||
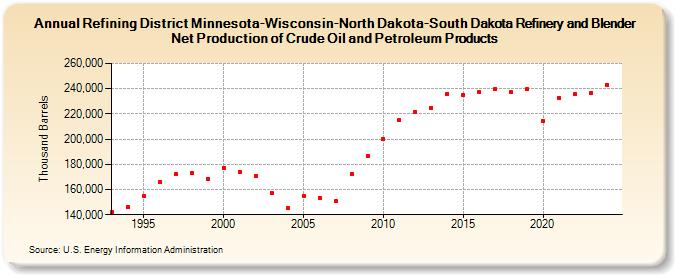
| Refining District Minnesota-Wisconsin-North Dakota-South Dakota Refinery and Blender Net Production of Crude Oil and Petroleum Products (Thousand Barrels) | ||||||||
| Decade | Year-0 | Year-1 | Year-2 | Year-3 | Year-4 | Year-5 | Year-6 | Year-7 | Year-8 | Year-9 |
|---|---|---|---|---|---|---|---|---|---|---|
| 1990's | 141,920 | 146,117 | 154,771 | 166,115 | 171,945 | 172,917 | 168,160 | |||
| 2000's | 177,273 | 173,856 | 170,758 | 157,566 | 145,107 | 154,994 | 153,588 | 150,727 | 172,501 | 186,370 |
| 2010's | 199,908 | 215,245 | 221,492 | 224,816 | 236,077 | 235,116 | 237,622 | 240,130 | 237,306 | 239,652 |
| 2020's | 214,535 | 232,658 | 235,978 | 236,504 |
| - = No Data Reported; -- = Not Applicable; NA = Not Available; W = Withheld to avoid disclosure of individual company data. |
| Release Date: 3/29/2024 |
| Next Release Date: 8/30/2024 |