|
Download Data (XLS File) |
|
||||||||
|
||||||||
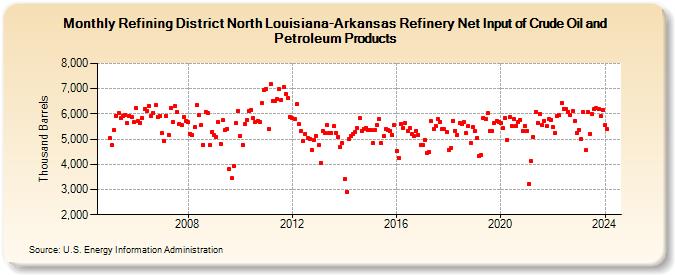
| Refining District North Louisiana-Arkansas Refinery Net Input of Crude Oil and Petroleum Products (Thousand Barrels) | ||||||||
| Year | Jan | Feb | Mar | Apr | May | Jun | Jul | Aug | Sep | Oct | Nov | Dec |
|---|---|---|---|---|---|---|---|---|---|---|---|---|
| 2005 | 5,031 | 4,751 | 5,371 | 5,902 | 6,031 | 5,844 | 5,918 | 5,969 | 5,633 | 5,935 | 5,887 | 5,666 |
| 2006 | 6,231 | 5,707 | 5,654 | 5,844 | 6,206 | 6,133 | 6,330 | 5,904 | 6,036 | 6,346 | 5,883 | 5,919 |
| 2007 | 5,240 | 4,934 | 5,907 | 5,182 | 6,238 | 5,697 | 6,295 | 6,083 | 5,609 | 5,541 | 5,889 | 5,722 |
| 2008 | 5,668 | 5,221 | 5,159 | 5,469 | 6,339 | 5,941 | 5,550 | 4,781 | 6,091 | 6,032 | 4,762 | 5,296 |
| 2009 | 5,144 | 5,080 | 5,673 | 4,817 | 5,746 | 5,356 | 5,414 | 3,794 | 3,445 | 3,929 | 5,632 | 6,116 |
| 2010 | 5,118 | 4,785 | 5,580 | 5,751 | 6,115 | 6,167 | 5,844 | 5,680 | 5,723 | 5,694 | 6,418 | 6,940 |
| 2011 | 6,987 | 5,407 | 7,171 | 6,513 | 6,521 | 6,573 | 6,971 | 6,567 | 7,050 | 6,805 | 6,646 | 5,859 |
| 2012 | 5,818 | 5,790 | 6,377 | 5,588 | 5,302 | 4,925 | 5,208 | 5,052 | 5,022 | 4,583 | 4,981 | 5,132 |
| 2013 | 4,756 | 4,058 | 5,316 | 5,259 | 5,557 | 5,240 | 5,249 | 5,516 | 5,260 | 5,094 | 4,678 | 4,851 |
| 2014 | 3,401 | 2,905 | 4,990 | 5,111 | 5,200 | 5,285 | 5,423 | 5,818 | 5,322 | 5,411 | 5,451 | 5,349 |
| 2015 | 5,367 | 4,826 | 5,369 | 5,542 | 5,795 | 4,845 | 5,119 | 5,396 | 5,361 | 5,333 | 5,160 | 5,563 |
| 2016 | 4,532 | 4,255 | 5,605 | 5,456 | 5,643 | 5,331 | 5,427 | 5,186 | 5,111 | 5,338 | 5,163 | 4,778 |
| 2017 | 4,769 | 4,975 | 4,462 | 4,503 | 5,700 | 5,408 | 5,539 | 5,784 | 5,696 | 5,386 | 5,385 | 5,300 |
| 2018 | 4,580 | 4,658 | 5,736 | 5,340 | 5,164 | 5,623 | 5,584 | 5,686 | 5,224 | 5,517 | 4,843 | 5,478 |
| 2019 | 5,322 | 5,051 | 4,334 | 4,374 | 5,837 | 5,788 | 6,038 | 5,309 | 5,323 | 5,656 | 5,722 | 5,694 |
| 2020 | 5,647 | 5,429 | 5,819 | 4,968 | 5,858 | 5,521 | 5,796 | 5,531 | 5,679 | 5,762 | 5,341 | 5,537 |
| 2021 | 5,332 | 3,238 | 4,116 | 5,065 | 6,092 | 5,652 | 6,000 | 5,547 | 5,723 | 5,510 | 5,806 | 5,776 |
| 2022 | 5,481 | 5,257 | 5,913 | 5,943 | 6,434 | 6,209 | 6,190 | 6,086 | 5,945 | 6,095 | 5,713 | 5,254 |
| 2023 | 5,374 | 5,009 | 6,072 | 4,557 | 6,088 | 5,213 | 6,013 | 6,176 | 6,218 | 6,180 | 5,902 | 6,160 |
| 2024 | 5,544 | 5,382 | ||||||||||
| - = No Data Reported; -- = Not Applicable; NA = Not Available; W = Withheld to avoid disclosure of individual company data. |
| Release Date: 4/30/2024 |
| Next Release Date: 5/31/2024 |