|
Download Data (XLS File) |
|
||||||||
|
||||||||
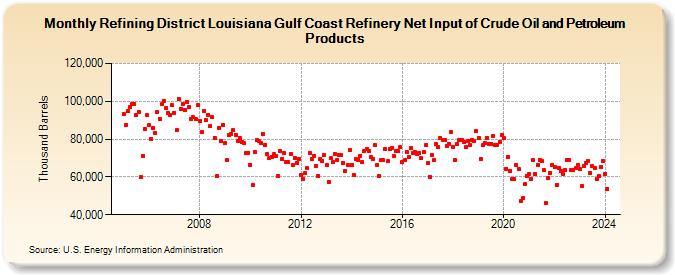
| Refining District Louisiana Gulf Coast Refinery Net Input of Crude Oil and Petroleum Products (Thousand Barrels) | ||||||||
| Year | Jan | Feb | Mar | Apr | May | Jun | Jul | Aug | Sep | Oct | Nov | Dec |
|---|---|---|---|---|---|---|---|---|---|---|---|---|
| 2005 | 93,265 | 87,508 | 94,677 | 96,902 | 98,338 | 98,656 | 92,858 | 94,574 | 59,927 | 71,062 | 85,595 | 92,561 |
| 2006 | 87,227 | 80,220 | 85,957 | 83,248 | 94,083 | 90,802 | 98,315 | 100,380 | 96,713 | 93,743 | 92,578 | 97,800 |
| 2007 | 94,007 | 84,596 | 101,235 | 96,055 | 98,471 | 95,589 | 99,757 | 96,837 | 90,475 | 91,438 | 90,510 | 97,866 |
| 2008 | 89,632 | 83,639 | 95,113 | 90,093 | 92,969 | 86,710 | 91,495 | 80,815 | 60,314 | 85,995 | 79,238 | 87,585 |
| 2009 | 77,786 | 68,801 | 82,306 | 82,594 | 84,637 | 82,373 | 78,861 | 80,691 | 78,701 | 77,674 | 72,598 | 72,671 |
| 2010 | 66,438 | 55,493 | 73,172 | 79,661 | 78,880 | 78,163 | 82,795 | 76,972 | 71,935 | 69,986 | 70,781 | 71,972 |
| 2011 | 70,877 | 60,486 | 73,512 | 69,679 | 72,652 | 67,818 | 67,715 | 72,200 | 66,334 | 70,091 | 67,596 | 69,344 |
| 2012 | 61,202 | 59,048 | 61,965 | 64,468 | 72,749 | 69,688 | 71,169 | 65,506 | 60,429 | 69,721 | 68,606 | 71,398 |
| 2013 | 66,036 | 57,524 | 69,782 | 67,714 | 72,249 | 68,810 | 71,547 | 71,476 | 67,274 | 63,162 | 66,226 | 74,269 |
| 2014 | 66,513 | 61,022 | 69,381 | 69,018 | 71,294 | 67,833 | 73,651 | 74,864 | 73,841 | 70,774 | 69,626 | 77,004 |
| 2015 | 66,341 | 60,490 | 69,127 | 68,777 | 74,594 | 68,221 | 74,692 | 75,399 | 71,063 | 73,522 | 73,480 | 75,605 |
| 2016 | 67,687 | 68,906 | 73,015 | 70,734 | 75,116 | 72,824 | 73,396 | 72,161 | 72,577 | 69,862 | 73,076 | 76,891 |
| 2017 | 67,429 | 59,977 | 71,373 | 68,845 | 77,517 | 75,700 | 80,496 | 79,388 | 79,565 | 76,341 | 77,599 | 83,967 |
| 2018 | 75,775 | 68,758 | 77,361 | 79,688 | 79,646 | 78,561 | 75,774 | 79,030 | 76,723 | 79,270 | 79,124 | 84,194 |
| 2019 | 80,717 | 69,510 | 76,706 | 78,029 | 80,783 | 77,596 | 77,569 | 81,743 | 76,786 | 77,110 | 78,633 | 82,253 |
| 2020 | 80,492 | 64,348 | 70,700 | 63,025 | 58,806 | 58,669 | 66,410 | 64,193 | 47,232 | 48,633 | 56,095 | 60,570 |
| 2021 | 61,705 | 58,755 | 68,792 | 61,476 | 66,391 | 69,012 | 68,523 | 63,412 | 45,984 | 59,396 | 62,100 | 66,535 |
| 2022 | 65,416 | 55,727 | 64,947 | 63,036 | 61,595 | 63,430 | 68,892 | 68,885 | 63,515 | 63,575 | 64,489 | 66,202 |
| 2023 | 64,285 | 55,057 | 65,631 | 67,100 | 68,311 | 62,092 | 65,750 | 64,778 | 58,843 | 60,563 | 65,419 | 68,339 |
| 2024 | 61,777 | |||||||||||
| - = No Data Reported; -- = Not Applicable; NA = Not Available; W = Withheld to avoid disclosure of individual company data. |
| Release Date: 3/29/2024 |
| Next Release Date: 4/30/2024 |