|
Download Data (XLS File) |
|
||||||||
|
||||||||
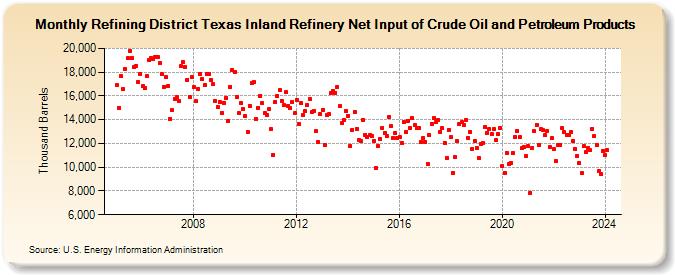
| Refining District Texas Inland Refinery Net Input of Crude Oil and Petroleum Products (Thousand Barrels) | ||||||||
| Year | Jan | Feb | Mar | Apr | May | Jun | Jul | Aug | Sep | Oct | Nov | Dec |
|---|---|---|---|---|---|---|---|---|---|---|---|---|
| 2005 | 16,878 | 15,019 | 17,672 | 16,581 | 18,260 | 19,159 | 19,806 | 19,216 | 18,421 | 18,519 | 17,163 | 17,829 |
| 2006 | 16,796 | 16,626 | 17,637 | 19,015 | 19,184 | 19,130 | 19,294 | 19,294 | 18,730 | 17,807 | 16,777 | 17,588 |
| 2007 | 16,837 | 14,081 | 14,792 | 15,759 | 15,944 | 15,565 | 18,495 | 18,834 | 18,413 | 17,365 | 15,900 | 17,587 |
| 2008 | 16,733 | 15,535 | 16,585 | 17,878 | 17,396 | 16,898 | 17,858 | 17,884 | 17,339 | 16,988 | 15,575 | 15,071 |
| 2009 | 15,526 | 14,587 | 15,427 | 15,852 | 13,911 | 16,790 | 18,187 | 17,998 | 15,948 | 14,533 | 15,397 | 14,917 |
| 2010 | 14,285 | 12,964 | 15,184 | 17,066 | 17,186 | 14,062 | 15,024 | 16,026 | 15,375 | 14,542 | 14,423 | 14,878 |
| 2011 | 13,198 | 11,068 | 15,513 | 15,994 | 16,485 | 15,572 | 15,197 | 16,317 | 15,179 | 15,002 | 15,508 | 14,539 |
| 2012 | 15,661 | 13,677 | 15,440 | 14,408 | 14,691 | 15,269 | 15,750 | 14,657 | 14,752 | 13,006 | 12,160 | 14,459 |
| 2013 | 14,806 | 11,898 | 14,428 | 14,470 | 16,267 | 16,437 | 16,271 | 16,754 | 15,113 | 13,682 | 13,982 | 14,741 |
| 2014 | 14,313 | 11,797 | 13,167 | 14,669 | 13,253 | 12,294 | 12,183 | 14,010 | 12,745 | 12,532 | 12,680 | 12,640 |
| 2015 | 12,207 | 9,926 | 11,767 | 12,389 | 13,340 | 12,889 | 12,605 | 14,241 | 13,451 | 12,465 | 12,916 | 12,480 |
| 2016 | 12,543 | 12,047 | 13,785 | 12,992 | 13,919 | 13,270 | 14,133 | 13,568 | 13,275 | 13,316 | 12,139 | 12,458 |
| 2017 | 12,129 | 10,251 | 12,749 | 13,657 | 14,099 | 13,776 | 14,009 | 12,994 | 13,273 | 12,067 | 10,789 | 13,144 |
| 2018 | 12,515 | 9,548 | 10,826 | 12,179 | 13,675 | 13,770 | 13,538 | 13,987 | 12,472 | 12,964 | 11,521 | 12,245 |
| 2019 | 11,641 | 10,761 | 11,990 | 12,037 | 13,370 | 12,906 | 13,234 | 12,800 | 13,211 | 12,279 | 12,775 | 13,309 |
| 2020 | 10,119 | 9,530 | 11,229 | 10,270 | 10,380 | 11,188 | 12,529 | 13,047 | 12,511 | 11,586 | 11,666 | 10,916 |
| 2021 | 11,754 | 7,866 | 11,651 | 13,020 | 13,576 | 11,856 | 13,203 | 13,107 | 12,723 | 13,016 | 11,705 | 12,446 |
| 2022 | 11,527 | 10,484 | 11,833 | 11,886 | 13,283 | 12,949 | 12,676 | 12,693 | 12,946 | 12,205 | 11,545 | 10,918 |
| 2023 | 10,343 | 9,488 | 11,756 | 11,267 | 11,640 | 11,420 | 13,237 | 12,605 | 11,886 | 9,651 | 9,450 | 11,400 |
| 2024 | 11,044 | |||||||||||
| - = No Data Reported; -- = Not Applicable; NA = Not Available; W = Withheld to avoid disclosure of individual company data. |
| Release Date: 3/29/2024 |
| Next Release Date: 4/30/2024 |